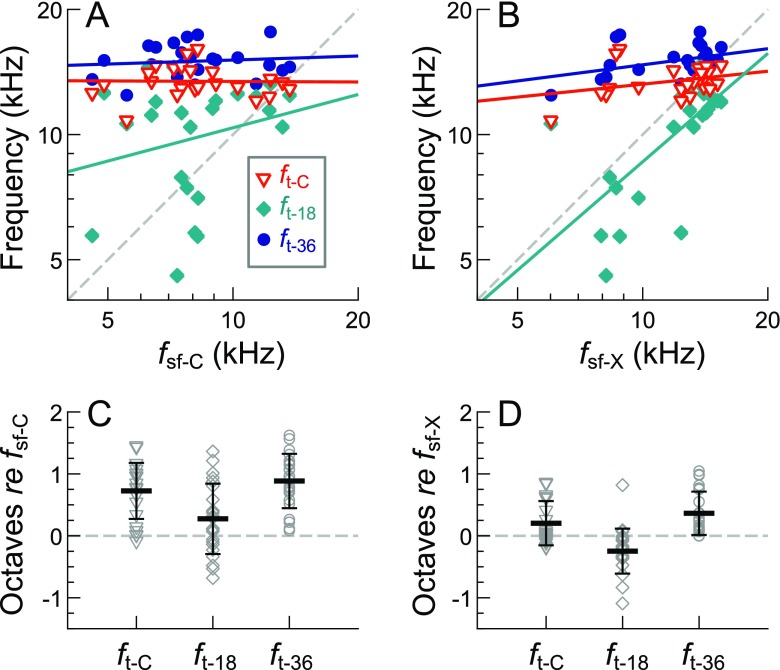
FIG. 6.
Relationships between audiometric and SFOAE landmark frequencies. A The SFOAE corner frequency (f sf-C) was not significantly correlated (p > 0.05) with the threshold corner frequency (f t-C; red triangles) or the frequencies of the 18- and 36-dB FPL threshold intercepts (f t-18 and f t-36; teal diamonds and blue circles). Linear regression fits (solid lines) and Pearson’s product–moment correlations were computed after converting all frequencies to an octave scale. B The high-frequency extent of measurable SFOAEs (f sf-X) was often close in frequency to f t-C and f t-36, though was only significantly correlated with f t-18 (R 2 (21) = 0.45, p = 0.00046). C, D Frequency differences (in octaves) between the audiometric and SFOAE landmark frequencies. Black horizontal lines and error bars indicate the average frequency difference ± 1 SD.

