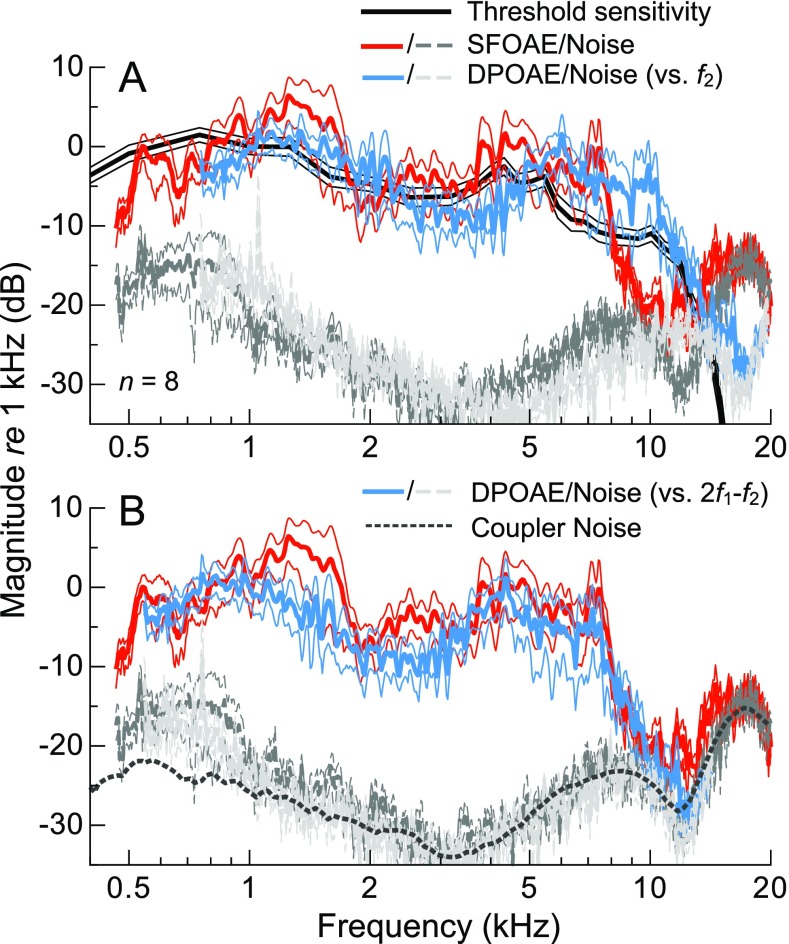
FIG. 7.
Average threshold sensitivity, SFOAE amplitude, and 2f 1-f 2 DPOAE amplitude curves, all normalized to their respective values at 1 kHz, for a subset of eight subjects. Thin lines indicate ±1 SE. When DPOAEs are plotted vs. f 2, (A) the high-frequency decline in the average DPOAE spectrum occurs about ∼0.5 octaves above that for SFOAEs and better matches the decline in average sensitivity. Due to plotting vs. f 2 rather than 2f 1-f 2, the average DPOAE noise floor (light dashed gray lines; normalized re the DPOAE magnitude at 1 kHz) appears to be a shifted version of the SFOAE noise floor (darker gray lines). When DPOAEs are instead plotted vs. 2f 1-f 2, (B) the offset between the high-frequency extents of the mean DPOAE and SFOAE magnitude curves is largely eliminated, suggesting a possible common dependence of SFOAEs and DPOAEs on the response frequency. The similar shapes of the DPOAE and SFOAE noise floors are due to compensating responses for the transfer function of the probe microphone and are not of biological origin. To illustrate this, the noise floor from a measurement in an ear simulator is also shown (after one-third-octave smoothing, for clarity, and vertical shifting to align with the SFOAE and DPOAE noise floors).

