FIG. 8.
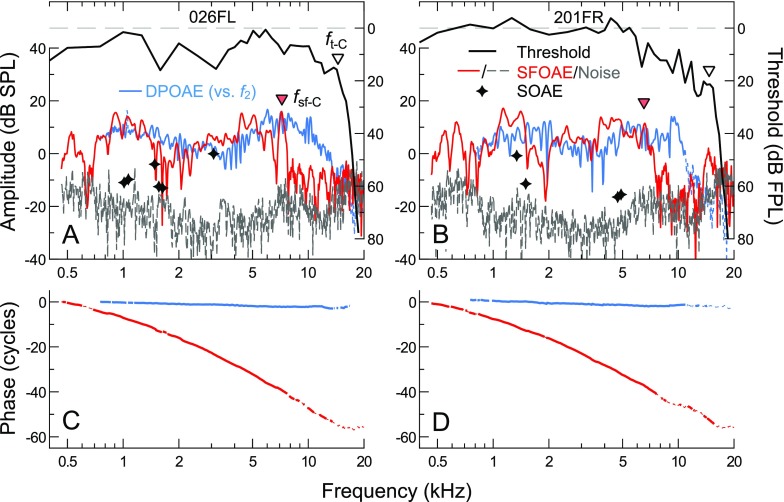
A, B Thresholds (black lines), SFOAE amplitudes/noise floors (red/dashed gray lines), and DPOAE amplitudes (blue lines) for two subjects. DPOAEs are plotted as a function of f 2. DPOAE noise floors are not shown for clarity, though thin dashed portions of the DPOAE amplitude curves indicated SNR <9 dB. For reference, threshold and SFOAE corner frequencies (f t-C and f sf-C) are also shown with open and filled triangles, respectively. SOAE frequencies and amplitudes are indicated by stars. C, D SFOAE and DPOAE phase as a function of frequency for the same two subjects, demonstrating that the two response types exhibit different phase behaviors (steeply sloping vs. flat with frequency) over a wide frequency range. Thin dashed portions of the curves indicate SNR <9 dB.

