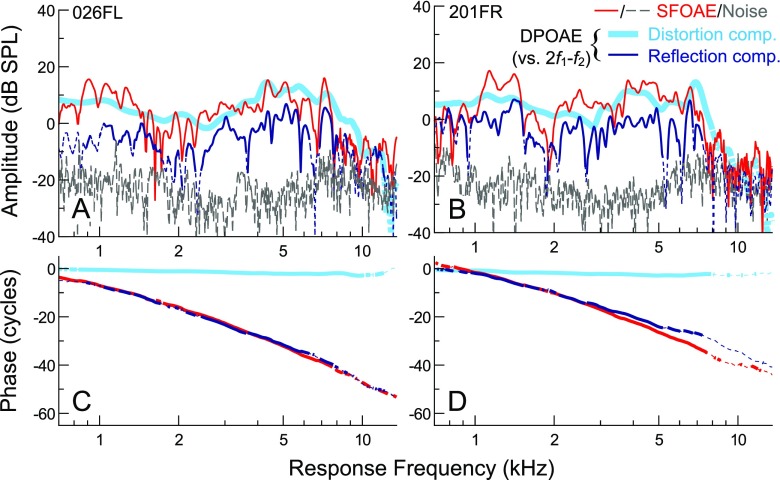
FIG. 9.
Comparison of SFOAE amplitudes (A, B) and phases (C, D) with those of the DPOAE distortion and reflection components, plotted vs. 2f 1-f 2. Data are from the subjects whose raw DPOAE responses are shown in Figure 8. Responses are only compared from 0.7 to 13.5 kHz due to edge effects of the DPOAE component separation procedure. The amplitude of the DPOAE reflection component (dark blue line) was ∼10 dB below that of the distortion component (thick light blue line) and the SFOAE (red line). However, the overall spectral shape and fine structure as well as the phase of the reflection component were highly similar to those of the SFOAEs from the same ear. DPOAE noise floors are not shown for clarity. Dashed portions of the DPOAE component amplitude and phase curves indicate SNR <9 dB.

