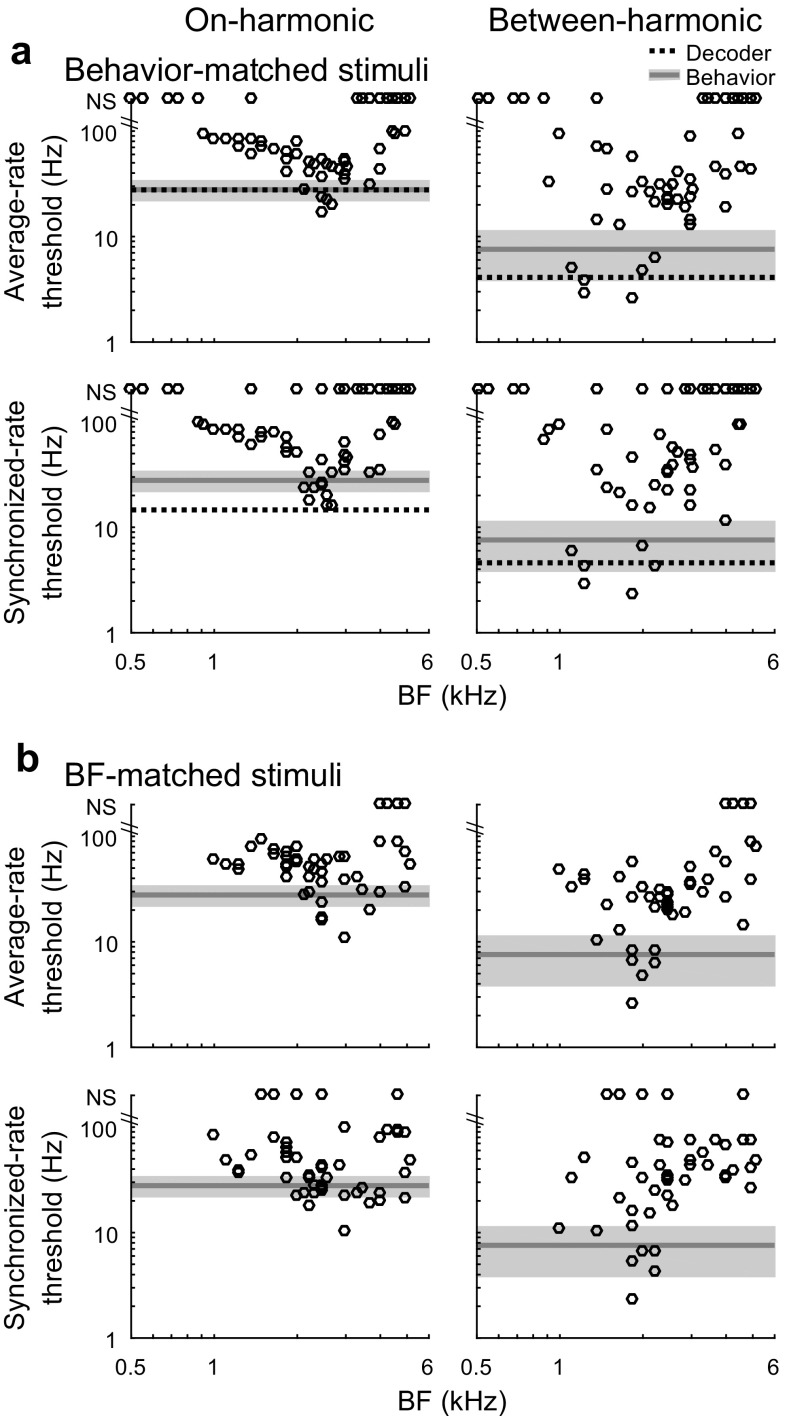
FIG. 5.
Neural thresholds for discrimination of formant frequency in quiet. Thresholds are shown for the reference stimuli matched to behavioral experiments (a) and matched to the BF of the recording site (b). Neural thresholds of individual recording sites (circles) were calculated based on ROC analysis of average rate (top) and synchronized rate to F0 (bottom) and are plotted as a function of BF along with thresholds of the optimally pooled neural population (horizontal dashed lines) and behavioral thresholds of the budgerigar (gray; means ± SD). Thresholds falling along the tops of each plot are not significant (‘NS’), i.e., exceed the upper limit of the estimation procedure

