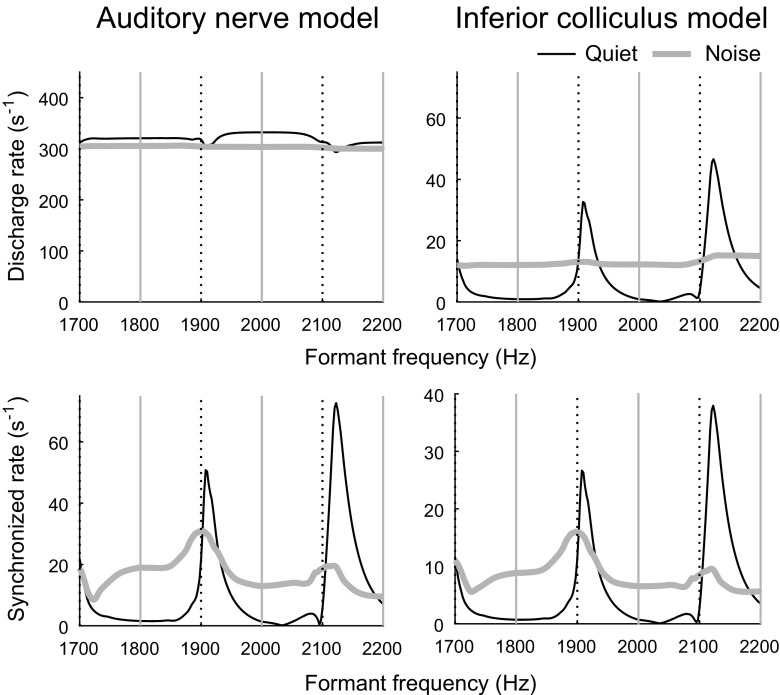
FIG. 8.
Representative single-formant responses from models of the auditory nerve (left) and IC (right). Predicted average rate (top) and synchronized rate to F0 (bottom) at each model stage are plotted as a function of formant frequency for stimuli in quiet and in noise. Model BF was 1.8 kHz; BMF was 200 Hz. The auditory nerve stage predicts peaks in synchronized rate to F0, but not average rate, when formant frequency is approximately between harmonics. IC model predictions are consistent with physiological data from the budgerigar: peaks in average rate occur approximately between harmonics in quiet but not in noise, while peaks in synchronized rate occur between harmonics both in quiet and in noise

