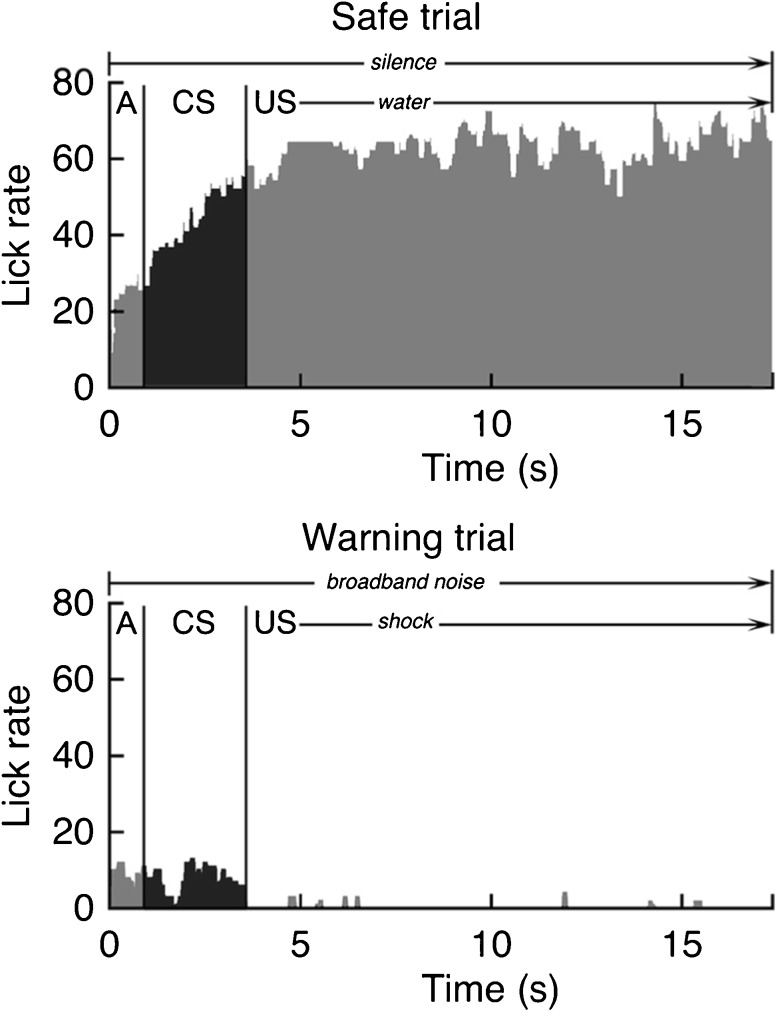
Fig. 2.
Peristimulus time histograms of drinking behavior. Cumulative lick rates are shown for one session’s safe trials (upper panel) and warning trials (lower panel). Each histogram is divided into an approach interval (A), a conditioned stimulus interval (CS), and an unconditioned stimulus interval (US). Classification training is indicated by high lick rates in the CS interval of safe trials and low lick rates in the CS interval of warning trials

