Figure 2.

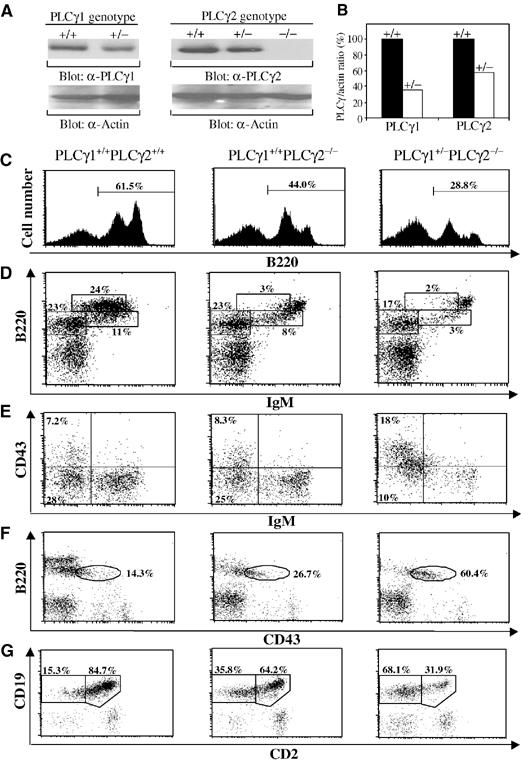
Gene dosage-dependent expression of PLCγ protein and impaired early B-cell development in PLCγ1+/−PLCγ2−/− mice. (A) Reduced expression levels of PLCγ1 and PLCγ2 protein in PLCγ1+/− and PLCγ2+/− splenocytes, respectively. PLCγ protein levels were determined by direct Western blot of cell lysates (20 μg) from splenocytes with wild-type (+/+), heterozygous PLCγ-deficient (+/−), or homozygous PLCγ-deficient (−/−) genotype using anti-PLCγ1 (α-PLCγ1), anti-PLCγ2 (α-PLCγ2), or anti-actin (α-actin) antibodies. (B) Quantitation of levels of PLCγ1 and PLCγ2 protein. The band densities of PLCγ and actin in (A) were quantified by densitometry. The ratios of the band densities of PLCγs versus actin were determined in wild-type (+/+) and heterozygous (+/−) splenocytes. PLCγ:actin ratios in +/+ splenocytes were assigned a value of 100% and the corresponding ratios in +/− splenocytes were calculated accordingly. (C–G) Bone marrow cells from mice of the indicated genotypes were stained with a combination of antibodies to B220, IgM, and CD43, or to CD19 and CD2. (C) Reduction of total B cells in bone marrow of PLCγ1+/−PLCγ2−/− mice. Histograms show the percentage of B220+ cells within the lymphoid cell gate. (D) FACS analysis with B220 and IgM staining. Percentages indicate cells in the gated lymphoid populations. (E) FACS analysis with CD43 and IgM staining of B220+ gated cells. Percentages indicate cells in the gated lymphoid populations. (F) FACS analysis with B220 and CD43 staining. Percentages indicate cells in B220+ gated cells. (G) FACS analysis with CD19 and CD2 staining. Percentages indicate cells in CD19+ gated cells. The FACS data shown are representative of eight mice per genotype.
