
Figure 1.
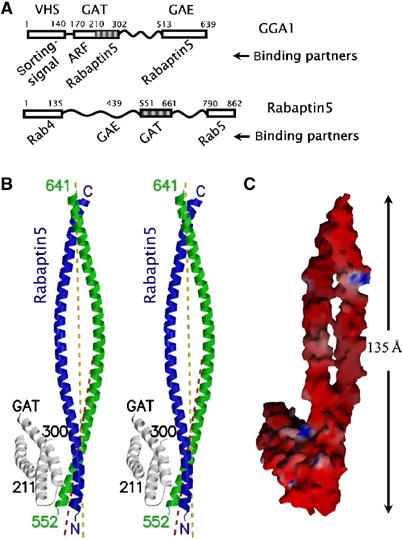
GAT–Rabaptin5 complex. (A) Schematic diagram of the constructs of GAT and Rabatin5 fragments. Known domains are shown as boxes with the residue numbers and names (if existing) marked on top. Relevant binding partners are listed below. Regions included in the crystal are shaded. (B) Stereo view of a ribbon diagram of the complex of GGA1 GAT three-helix bundle domain (white) and Rabaptin5551–661 (blue and green). The crystallographically visible peptide termini are labeled either as N/C or with residue numbers. The major local two-fold axis of the Rabaptin5551–661 homodimer is depicted as a yellow dash line, and the two-fold axis of the GAT-binding region is shown as a red dash line. (C) Molecular surface model of the complex. The color intensity corresponds to the electrostatic potential calculated with the program GRASP and its default parameters, from −8 kT e−1 (intense red) to +8 kT e−1 (intense blue). Figures 1B, 2A, 4A, and 6 were drawn with the programs MolScript and Raster3D. Figures 1C and 2B were drawn with the program GRASP.