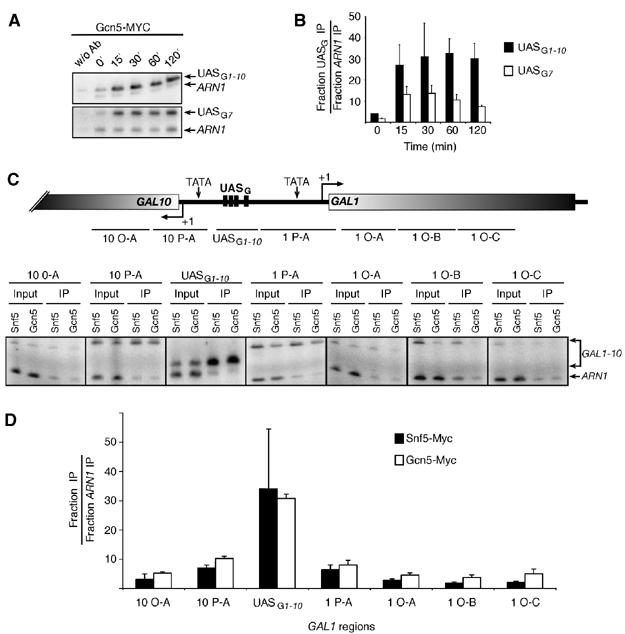
Figure 2.

Distribution of Swi/Snf and SAGA at the GAL1-10 locus. (A) ChIP analysis of the binding of Gcn5-Myc (KLY031) to the GAL1 and GAL7 UASG during galactose induction. (B) Quantification of experiments as illustrated in (A). (C) Top: Representation of the GAL1-10 locus. Regions amplified in the GAL10 open reading frame (10 O-A), the GAL1-10 promoter region (10 P-A, UASG1-10, and 1 P-A) and in the GAL1 open reading frame (1 O-A to 1 O-C) are represented. Bottom: Distribution of Snf5-Myc and Gcn5-Myc over the GAL1-10 locus. ChIP analysis of the binding of Snf5-Myc and Gcn5-Myc to the GAL1-10 locus after 30 min addition of galactose. Data of input and immunoprecipitated material are shown for each region investigated. (D) Quantification of experiments as illustrated in (C).
