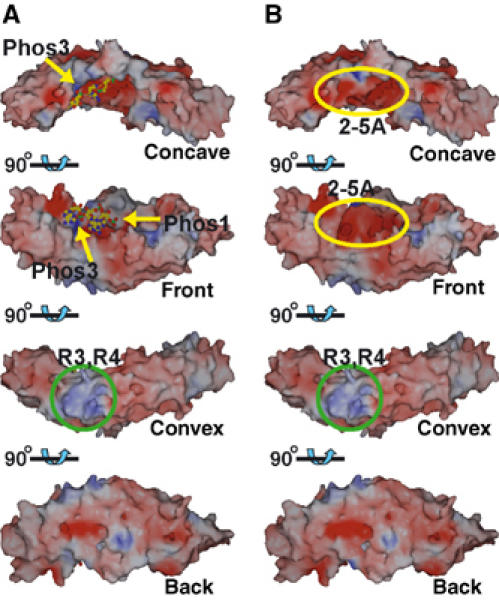
Figure 6.

Electrostatic surface potential of ANK. The surfaces are shown in blue and red to indicate positive and negative charges, respectively, from 20 to −20 kT. The view at top is the same as the view provided in Figure 1C. (A) Surface potential of ANK without 2-5A. The bound 2-5A is shown as a ball-and-stick model and has been omitted from the potential calculation. The phosphate binding sites are indicated by yellow arrows. A remarkable basic patch near repeats 3 and 4 is indicated within a green circle. (B) Surface potential of the ANK/2-5A complex. The negative patch arising from bound 2-5A is indicated in a yellow ellipsoid.
