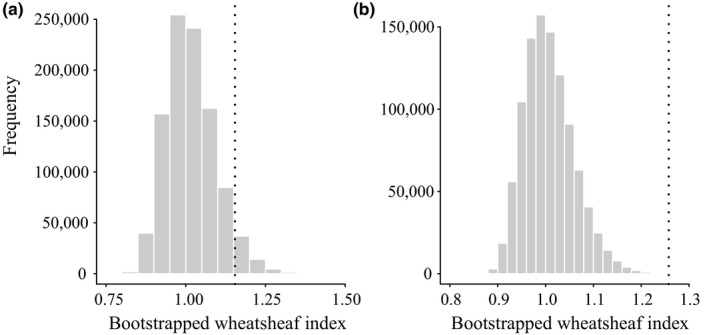
Figure 3.

Strength of convergence as measured by the Wheatsheaf index for social breeding (a) and foraging (b) species. Histograms represent the distribution of the Wheatsheaf index for 1,000,000 randomizations of the data, and the dashed lines show the value of the Wheatsheaf index for the observed data
