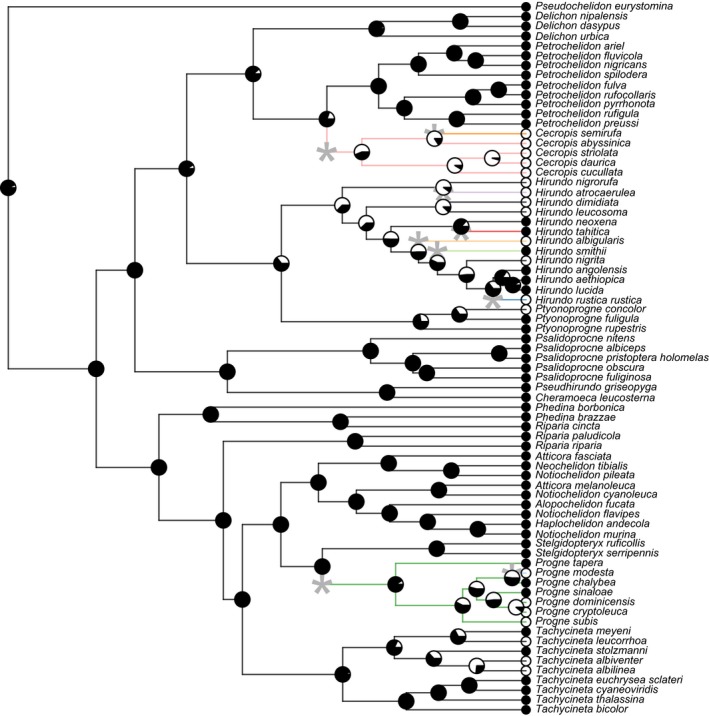
Figure 5.

Ancestral reconstruction of foraging behavior using the threshold model and evolutionary regimes using l1ou. As in Figure 4, white icons denote solitary species, while black indicates social species, and pie charts at each node show the posterior probability of each character state at that node. Edges are colored by regime, and asterisks denote the location of regime shifts
