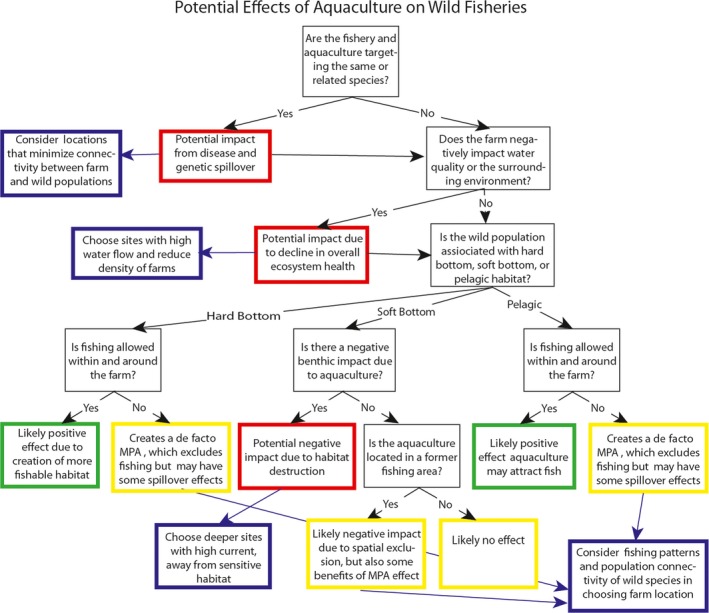
Figure 2.

A flowchart for assessing the potential risks of an open‐ocean fish farm on wild fisheries, assuming best practice on‐farm management, and siting of the farm over soft‐bottom habitat. Black boxes represent questions about the attributes of the farm or environment that affect the outcomes; red, yellow, and green boxes represent potential (not mutually exclusive) effects on wild fisheries (indicating a risk of negative effects, neutral or mixed effects, and positive effects, respectively); and blue boxes represent potential spatial planning solutions to help mitigate risks. See text for supporting references
