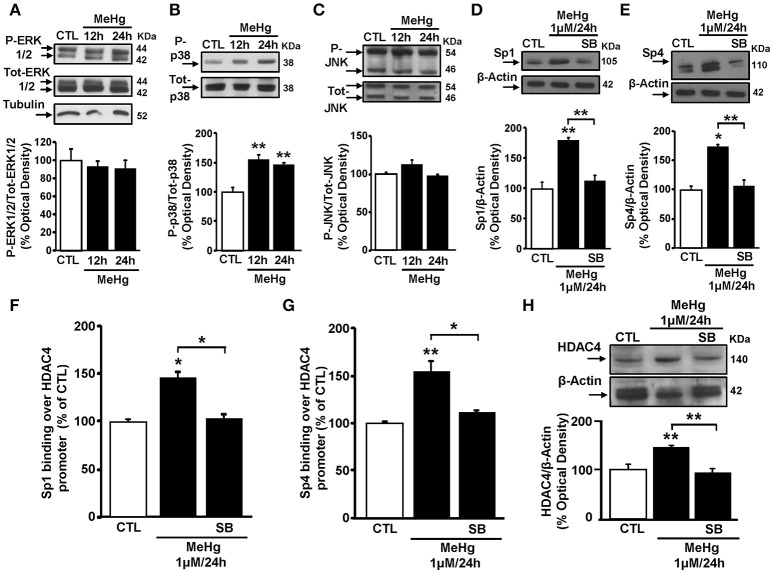
Figure 3.
p38 MAPK inhibitor SB239063 reverts Sp1 and Sp4 protein expression increase and blocks their binding on HDAC4 promoter sequence and its down-regulation. (A–C) Western blotting of P-ERK1/2, P-p38, and P-JNK in SH-SY5Y cells treated with 1 μM of MeHg for 12 and 24 h. Bars represent the mean ± S.E.M. obtained from three independent experiments. Asterisk symbols on columns indicate differences between CTL and MeHg. **p < 0.01 (one-way ANOVA with Turkey's post-hoc test). (D,E) Western blotting of Sp1 and Sp4 in SH-SY5Y cells treated with MeHg (1 μM/24 h), alone or in combination with SB239063 (SB). Bars represent the mean ± S.E.M. obtained from three independent experiments. Asterisk symbols on columns indicate differences compared to CTL. Asterisk symbols on brackets indicate significance between MeHg and SB. **p < 0.01, *p < 0.05 (one-way ANOVA with Turkey's post-hoc test). (F,G) ChIP analysis of the Sp1 sites on HDAC4 gene promoter regions carried out with anti-Sp1 and anti-Sp4, in SH-SY5Y cells treated with MeHg (1 μM/24 h), alone or in combination with SB. The binding activity of Sp1 and Sp4 is graphically represented as the percentage of the control. Each column represents the mean ± S.E.M (n = 3). Asterisk symbols on columns indicate differences between control CTL and MeHg. Asterisk symbols on brackets indicate significance between MeHg and SB+MeHg. **p < 0.01, *p < 0.05 (one-way ANOVA with Turkey's post-hoc test). (H) Western blotting of HDAC4 in SH-SY5Y cells treated with MeHg (1 μM/24 h), alone or in combination with SB. Bars represent the mean ± S.E.M. obtained from three independent experiments. Asterisk symbols on columns indicate differences between CTL and MeHg. Asterisk symbols on brackets indicate significance between MeHg and SB+MeHg. **p < 0.01 (one-way ANOVA with Turkey's post-hoc test).

