
Figure 4.
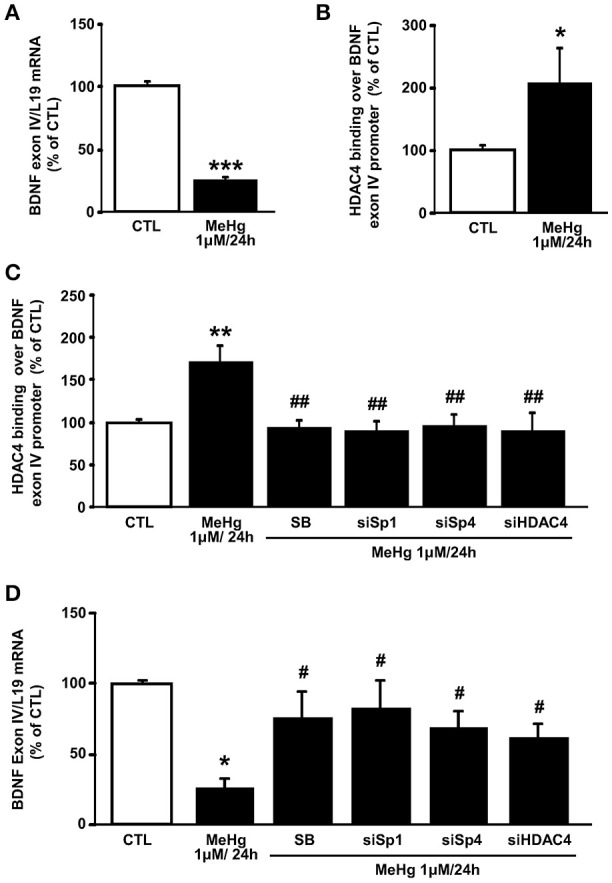
MeHg increases HDAC4 binding on BDNF exon IV promoter, by the p38/Sp1/Sp4 axis, determining its gene reduction. (A) qRT-PCR of BDNF exon IV in SH-SY5Y treated with MeHg (1 μM/24 h). Graphs show quantification of ratio of BDNF exon IV to L19. Bars represent mean ± S.E.M. obtained from three independent experiments. ***p < 0.001 (unpaired t-test). (B) ChIP analysis of the BDNF exon IV promoter regions carried out with anti-HDAC4, in SH-SY5Y cells treated with MeHg (1 μM/24 h). The binding activity of HDAC4 is graphically represented as the percentage of CTL. Each column represents the mean ± S.E.M (n = 3). *p < 0.05 (unpaired t-test). (C) ChIP analysis of the BDNF exon IV promoter regions carried out with anti-HDAC4, in SH-SY5Y cells treated with MeHg (1 μM/24 h), alone or in combination with SB SB239063, and treated with MeHg and transfected with siRNA for Sp1 (siSp1), Sp4 (siSp4), or HDAC4 (siHDAC4). The binding activity of HDAC4 is graphically represented as the percentage of (CTL). Each column represents the mean ± S.E.M (n = 3). Asterisk symbols on columns indicate differences between control CTL and MeHg. Hashtag symbols on columns indicate significance compared to MeHg. **p < 0.01, ##p < 0.01 (one-way ANOVA with Turkey's post-hoc test). (D) qRT-PCR of BDNF exon IV in SH-SY5Y treated with MeHg (1 μM/24 h), alone or in combination with SB, and treated with MeHg and transfected with siRNA for Sp1 (siSp1), Sp4 (siSp4), or HDAC4 (siHDAC4). Graphs show quantification of ratio of BDNF exon IV to L19. Bars represent mean ± S.E.M. obtained from three independent experiments. Asterisk symbols on columns indicate differences between control CTL and MeHg. Hashtag symbols on columns indicate significance compared to MeHg. *p < 0.05, #p < 0.05 (one-way ANOVA with Turkey's post-hoc test).