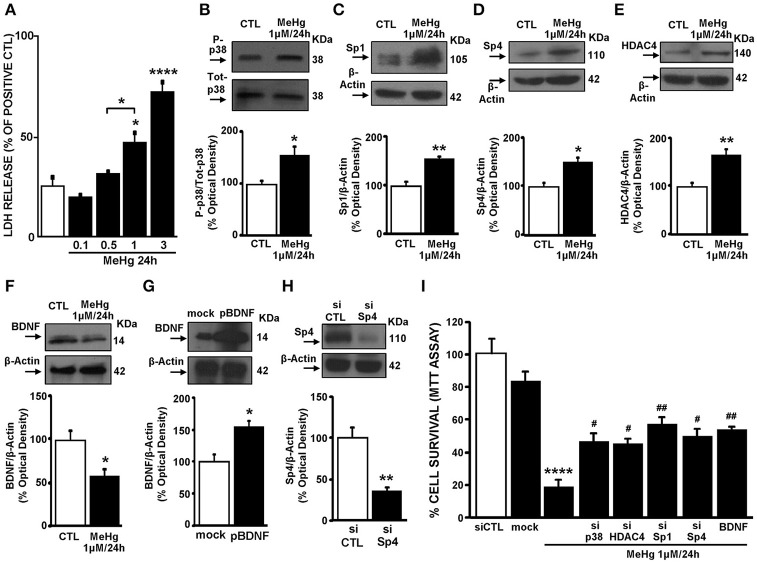
Figure 5.
MeHg by activating the p38/Sp1/Sp4/BDNF axis induced cell death in cortical neurons. (A) Effect of 24 h of MeHg (0.1, 0.5, 1, and 3 μM) exposure on LDH release in cortical neurons. Bars represent the mean ± S.E.M. obtained in three independent experiments. Asterisk symbols on columns indicate differences between CTL and MeHg treatment. Asterisk symbols on brackets indicate differences between MeHg groups. *p < 0.05, ****p < 0.0001 (one-way ANOVA with Turkey's post-hoc test). (B–F) Western blotting of P-p38, Sp1, Sp4, HDAC4, and BDNF in cortical neurons treated with 1 μM of MeHg for 24 h. Bars represent the mean ± S.E.M. obtained from three independent experiments. Asterisk symbols on columns indicate differences between CTL and MeHg. **p < 0.01, *p < 0.05 (unpaired t-test). (G) Western blotting of BDNF in cortical neurons transfected for 24 h with plasmid overexpressing BDNF or with the empty vector (mock). Bars represent the mean ± S.E.M. obtained from three independent experiments. * p < 0.05 (unpaired t-test). (H) Western blotting of Sp4 in cortical neurons transfected for 24 h with a specific siRNA for Sp4 or with scramble (siCTL). Bars represent the mean ± S.E.M. obtained from three independent experiments. **p < 0.01 (unpaired t-test). (I) Effect of 24 h of MeHg (1 μM) exposure on LDH release in cortical neurons transfected with siRNAs for p38, Sp1, Sp4, and HDAC4 or with pBDNF. Bars represent the mean ± S.E.M. obtained in three independent experiments. Asterisk symbols on columns indicate differences between CTL and MeHg treatment. Hashtag symbols on columns indicate significance compared to MeHg. ##p < 0.01, #p < 0.05 (one-way ANOVA with Turkey's post-hoc test).

