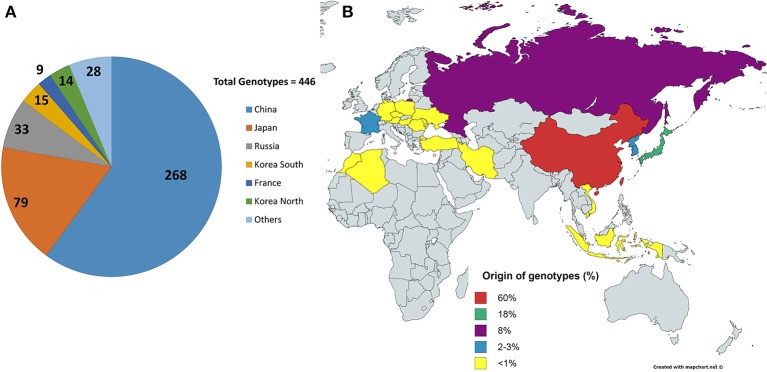
Figure 1.
Origins of the lines. (A) Shows the distribution of the 446 lines/genotypes based on origins, collected from USDA soybean line collection. China and Japan are the highest contributors in the selected collection. (B) Shows the origins in terms of percentage contribution from different countries. Yellow shows countries with <1% contribution, i.e., four genotypes or less.

