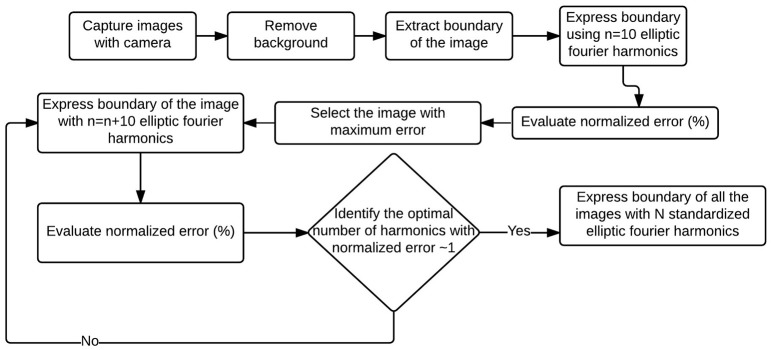
Figure 3.
Flowchart to evaluate EFDs for a set of images. First canopy outline/boundary from all the images were captured and expressed using 10 elliptic Fourier harmonics. The worst (in terms of deviation from the original outline) reconstructed outline (which is also the most complex outline) from the EFDs was identified. Optimal number of harmonics of the complex outline was identified, and all the outlines were expressed using that optimal number of harmonics.

