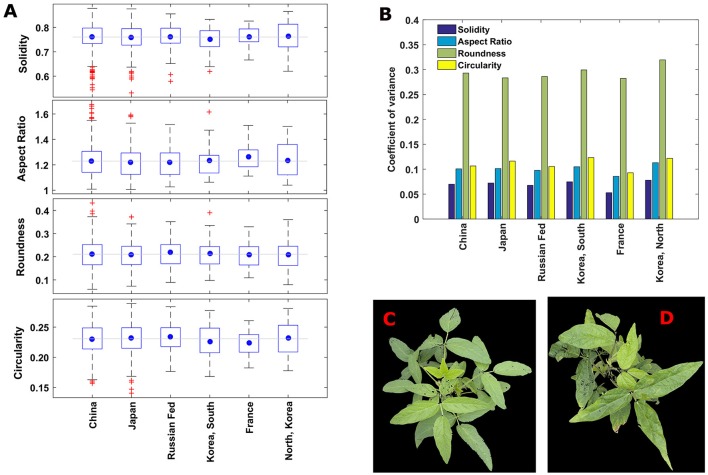
Figure 6.
(A) Boxplots showing the variation of traditional traits among the plants with different countries of origin. The blue circle shows the mean value of a trait in an origin and gray horizontal line indicates overall mean value the trait including all the origins. (B) Coefficient of variance of the canopy morphometric traits among major geographical countries of origin. Roundness has the highest diversity and solidity has the lowest diversity in all the countries. (C,D) Representative images of canopies those are outliers in solidity (in A). (C) A canopy of line/genotype PI567159A from china and (D) a canopy of line/genotype PI594170B from Japan.

