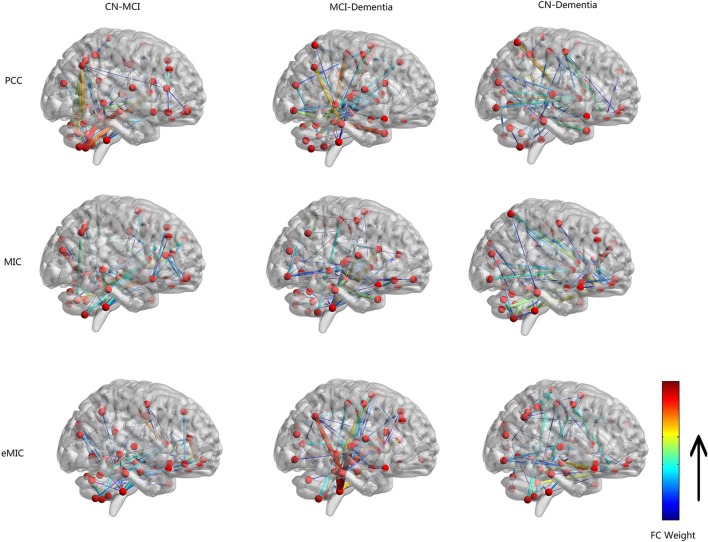
Figure 1.
Network graph of functional connectivity (FC) with high discrepancy based on all subjects. Nodes correspond to brain regions of automatic anatomical labeling. Edges between different nodes in the graph correspond the FC with high discrepancy. Color and line width of edges represent the weight of difference.

