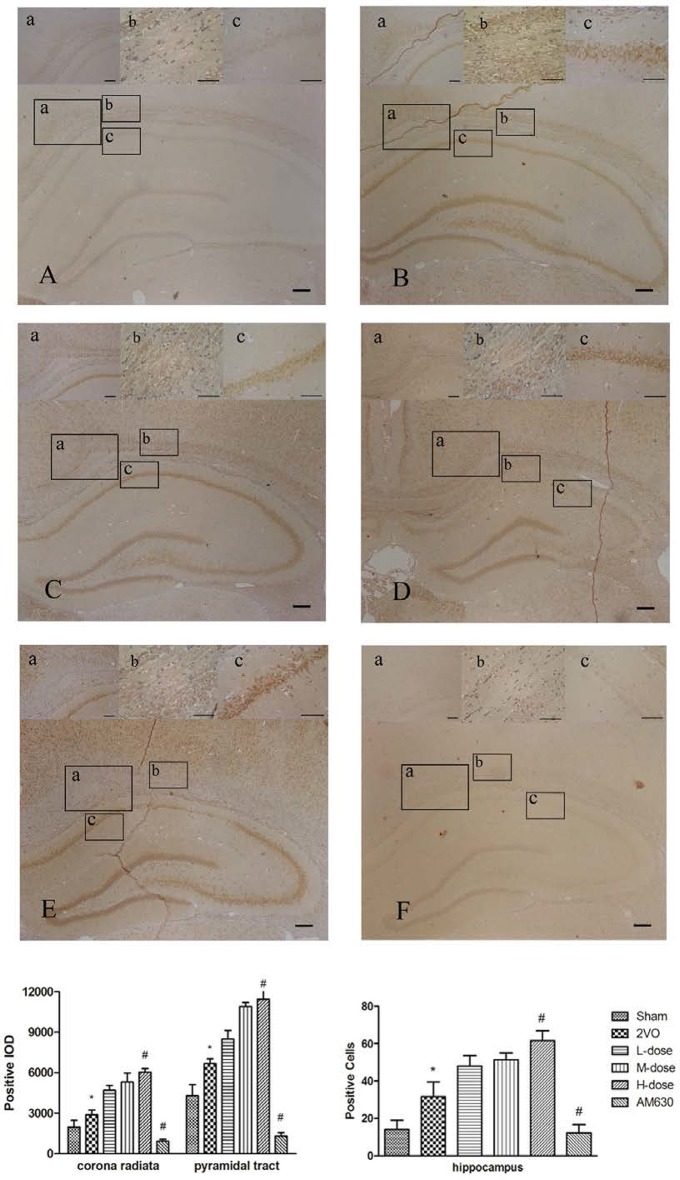
Figure 12.
Immunohistochemical staining showed the expressions of CB2 in corona radiata (a), pyramidal tract (b) and hippocampus CA1 region (c) in different groups: sham group (A), 2VO group (B), BCP low dose group (C), BCP middle dose group (D), BCP high dose group (E), and AM630 group (F). The expression levels of the CB2 increased in the 2VO group compared with those in sham group. The HPβCD/BCP significantly increased the expression levels of CB2, and the CB2 expression levels increased with the increase of BCP concentration. In the AM630 group, the CB2 presented extremely low expression levels. The bar is 100 μm (*P < 0.01 vs. sham group, #P < 0.001 vs. 2VO group).

