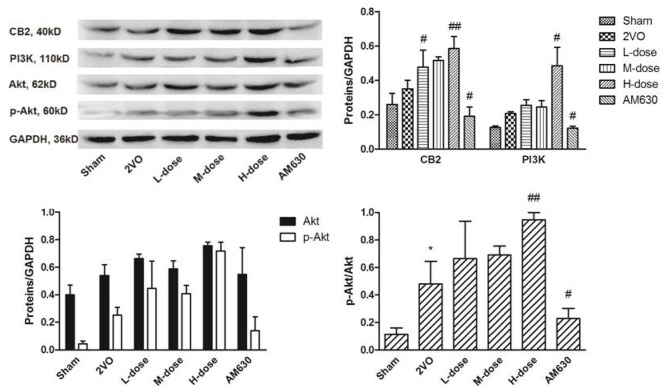
Figure 13.
The expressions of CB2, PI3K and Akt in rats' brain tissues of different groups. The expression levels of the CB2 and PI3K increased slightly in the 2VO group compared with those in the sham group. After HPβCD/BCP treatment, the expression levels of CB2 and P13K, p-Akt increased compared with those of the 2VO group, whereas these levels decreased in the AM630 treated group. (*P < 0.05 vs. sham group, #P < 0.05 vs. 2VO group, ##P < 0.01 vs. 2VO group).

