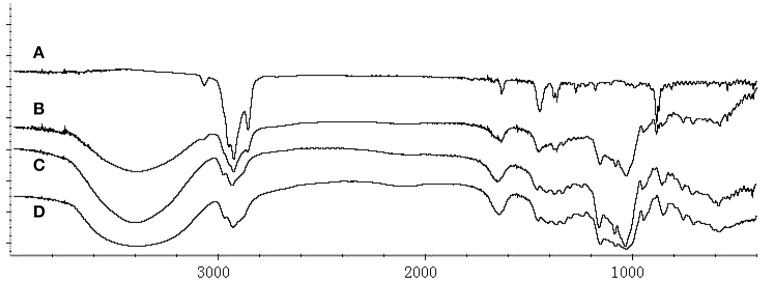
Figure 5.
FT-IR spectra of (A) BCP, (B) physical mixture, (C) HPβCD, and (D) HPβCD/BCP. The BCP spectrum showed the bands from 3070 to 2680 cm−1 and 1637 to 870 cm−1. The physical mixture presented the absorption band of BCP at 885 cm−1. HPβCD showed a absorption bands at 3401 cm−1. HPβCD/BCP showed only a few identical features compared with BCP.

