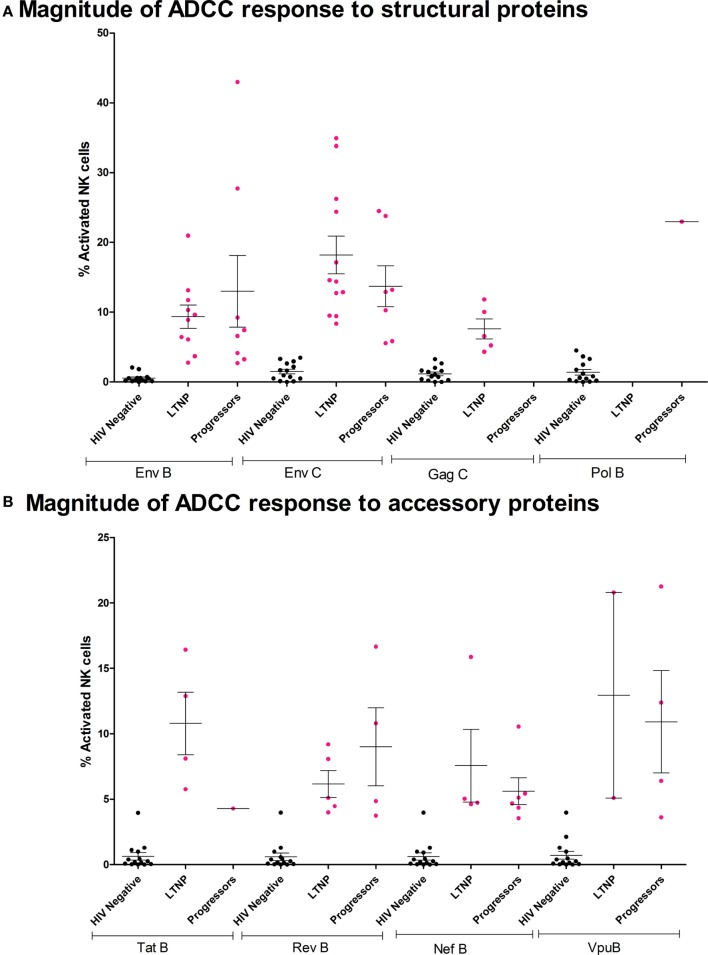
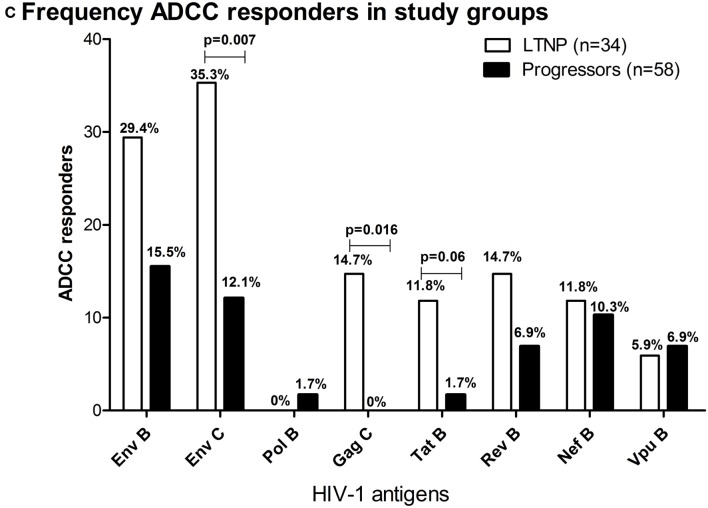
Figure 2.
Characteristics of ADCC responses in Indian long-term non-progressors (LTNPs) and progressors. Vertical scatter plots (error bars—mean with SEM) denote magnitudes of ADCC-mediated natural killer (NK) cell activation in responders from LTNPs and progressors against HIV-1 antigen peptide pools. Magnitude of ADCC response against (A) structural proteins: HIV-1 B Env, HIV-1 C Env, HIV-1 C Gag, and HIV-1 B Pol and (B) accessory proteins: HIV-1 B Tat, Rev, Nef, and Vpu. The magenta colored dots represent ADCC responders (fulfilled both criteria mentioned in Materials and Methods section). The non-specific recognition of the peptides as indicated by the % NK cell activation by HIV-negative plasma after stimulation by same peptide pools is indicated in black dots. (C) Bar diagram represents the frequency of responses in both cohorts against HIV-1 B and C Env, HIV-1 C Gag, HIV-1 B Pol, Tat, Rev, Nef, and Vpu. The frequencies were higher in LTNPs in case of responses against Env subtype C and Gag, whereas a trend of higher tat-specific responses was observed in LTNPs although not significant (Fisher’s exact 2 × 2 test).


