Figure 3.
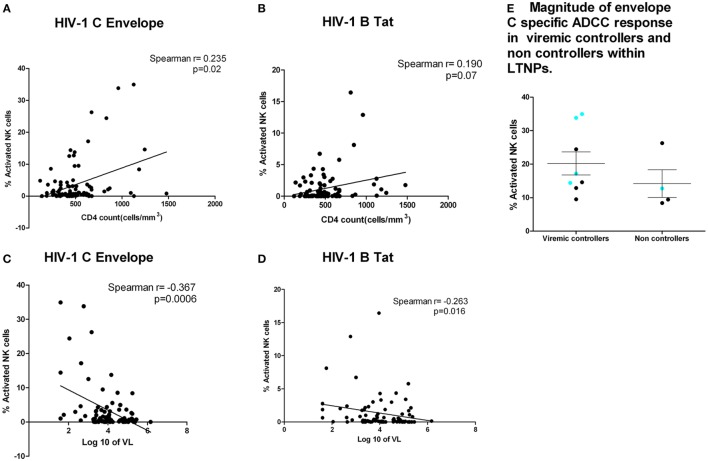
ADCC responses were associated with higher CD4 count and lower plasma viral load. CD4 counts at the testing visit (N = 92) (X axis) with envelope C peptide pool (Y axis) (p = 0.02) (A) and Tat-specific ADCC responses (Y axis) (p = 0.07) (B). (C,D) Association of plasma viral load at the testing visit (N = 92) with ADCC response against Env-C peptide pool and Tat B peptide pool, respectively. (E) Magnitude of envelope C-specific ADCC response in viremic controllers and non-controllers within long-term non-progressors (LTNPs). The magnitude of ADCC responses [% natural killer cell activation] was comparable in between the groups, but the number of responders to envelope C was high in viremic controllers (8 out of 12) (plasma viral load <2,000 copies/ml) as against 4 out of 22 LTNPs with plasma viral load >2,000 copies/ml. Additionally, the preferential recognition of V3 region (aa 288–330) as indicated by blue dot was seen in four out of eight responders from viremic controller LTNPs as against only one out of four responders from non-controllers.

