
Figure 4.
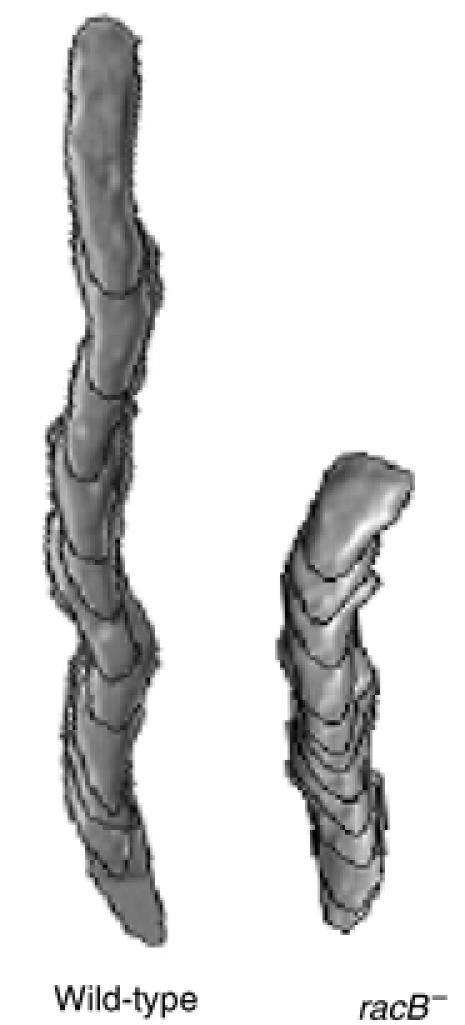
Computer-assisted analysis of chemotaxis (DIAS) of wild-type and racB null cells. The figure depicts the overlapping DIAS image analysis of chemotaxing cells. Overlapping images were captured at 1-min intervals. Cells for analysis were chosen randomly and the paths examined represent a 10-min interval taken from the middle of the chemotaxis movie. The image illustrates the shape, total distance moved, and directionality of movement.