
Figure 7.
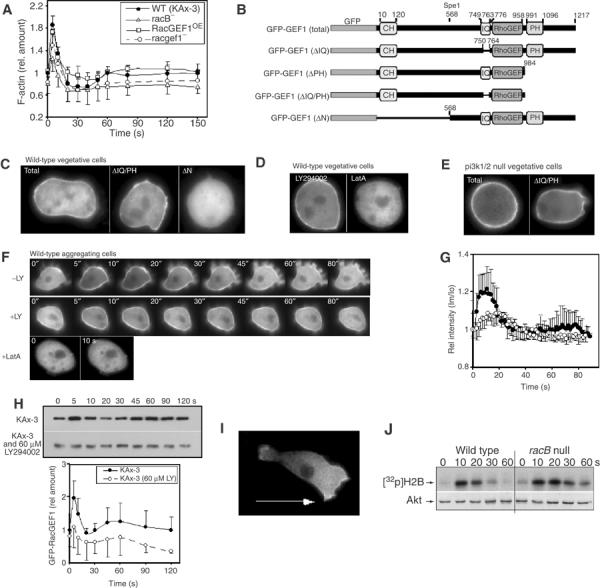
Subcellular localization of GFP-RacGEF1. (A) F-actin profiles of wild-type, racB null, and racgef1 null and overexpressing cells. (B) Maps of GFP-RacGEF1 wild-type and mutant constructs. (C–E) Subcellular localization in vegetative cells of GFP-RacGEF1, GFP-RacGEF1ΔIQ/PH, and GFP-RacGEF1ΔN (C); GFP-RacGEF1 in the presence of LY294002 or LatA (D); GFP-RacGEF1 and RacGEF1ΔIQ/PH in pi3k1/2 null cells (E). (F) Translocation of GFP-RacGEF1 was imaged after stimulation with cAMP in the presence or absence of LY294002 or LatA (pretreated with 60 μM LY294002 or 2 μM LatA for 30 min). (G) Quantitation of the results of untreated and LY294002-treated cells depicted in (F) (see Supplementary data for a detailed protocol). The fluorescence intensity of membrane-localized GFP fusion protein was quantitated using the linescan module of Metamorph software. Im/Io is plotted as a measure of the fluorescence intensity at a point on the membrane relative to that at the cytoplasm. (H) RacB activation in wild-type (Figure 2) and LY294002-treated cells. (J) Akt activation in wild-type and racB null cells.