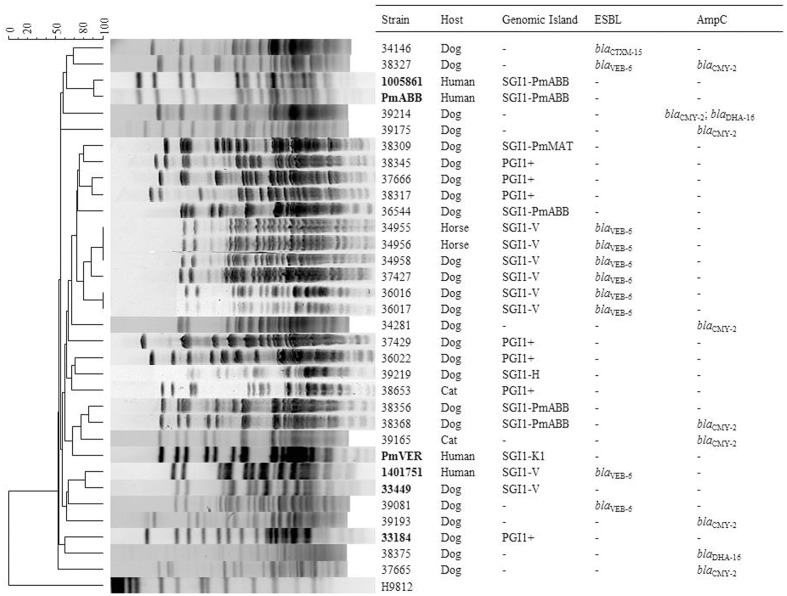
FIGURE 2.
Analysis of SmaI-Pulsed-Field Gel Electrophoresis (PFGE) patterns obtained from the relevant P. mirabilis isolates. PFGE profiles were compared using BioNumerics software version 4.5 (Applied Maths) with settings of 0.5% optimization and 1.0% tolerance. DNA of S. enterica serovar Braenderup strain H9812 was used as standard size marker in PFGE experiments and as outgroup in analysis (Hunter et al., 2005). The isolates in bold correspond to previously published profiles included for comparison purposes (Schultz et al., 2015).

