Figure 3.
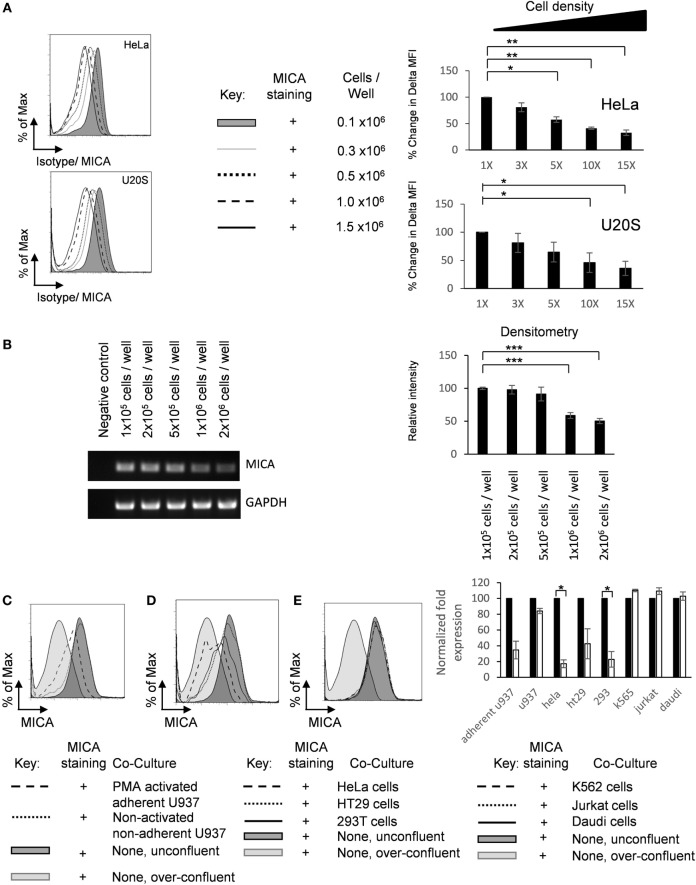
Adherent cell–cell contact downregulates MICA expression. (A) HeLa and U2OS cells were seeded into six-well plate at indicated cell density, cultured for 72 h, and analyzed for surface MICA expression by flow cytometry n = 3. (B) U2OS cells were plated at increasing densities and MICA mRNA analyzed compared to a GAPDH control. Normalized quantification is shown in the bar chart. n = 3. (C) U2OS cells were stained with CFSE and plated at 10% confluence (shaded dark gray histogram), over-confluent (shaded light gray histogram), or cocultured with either PMA-activated adherent U937 cells (dashed histogram) or non-adherent U937 cells (dotted histogram). (D) These cells were also grown in coculture with adherent HeLa cells (dashed histogram), adherent HT29 cells (dotted black histogram), or adherent HEK293T cells (solid histogram). (E) U2OS cells were also grown with suspension cells K-562 cells (dashed histogram), Jurkat cells (dotted histogram), or Daudi cells (solid histogram). Forty-eight hours later, CFSE-stained U2OS cells were analyzed for MICA expression. n = 3 independent experiments.

