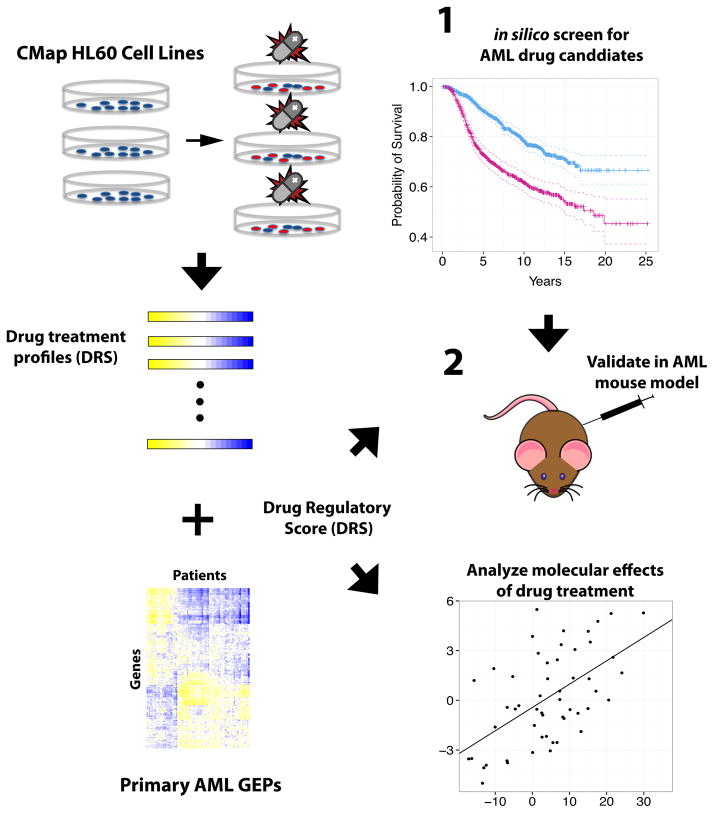
Fig. 1. Flowchart of integrated screening pipeline.
Drug treatment profiles from HL60 cell lines were integrated with AML patient gene expression profiles to derive DRS profiles for each drug. Survival analysis of DRS profiles was implemented to identify drugs associated with patient survival. Selected candidates were then validated in an AML mouse model.

