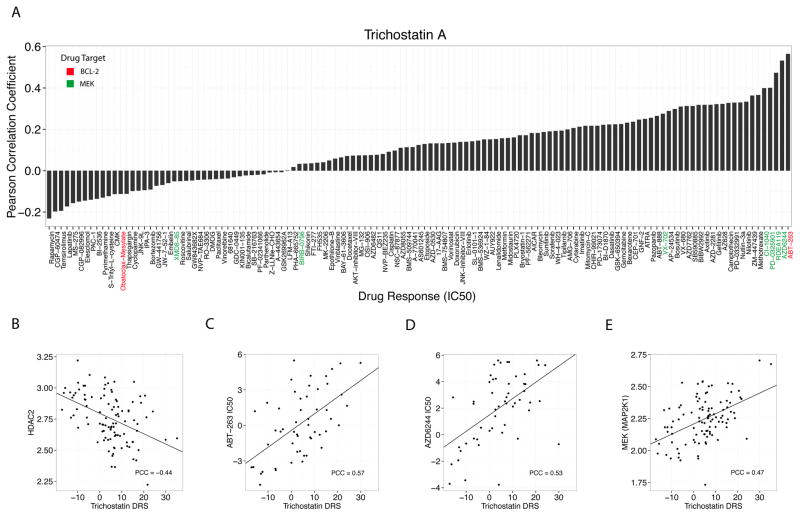
Fig. 4. Correlation of TSA with drug IC50 and mRNA expression across 102 blood-derived GDSC cell lines.
(A) Correlation of TSA DRS with IC50 of 125 drugs from the GDSC database (B) TSA DRS is anticorrelated with HDAC2 mRNA expression, (C) TSA DRS is correlated with ABT-263 (Bcl2 inhibitor) IC50 (D) TSA DRS is correlated with AZD6244 (MEK inhibitor) IC50 (E) TSA DRS is correlated with MEK mRNA expression.

