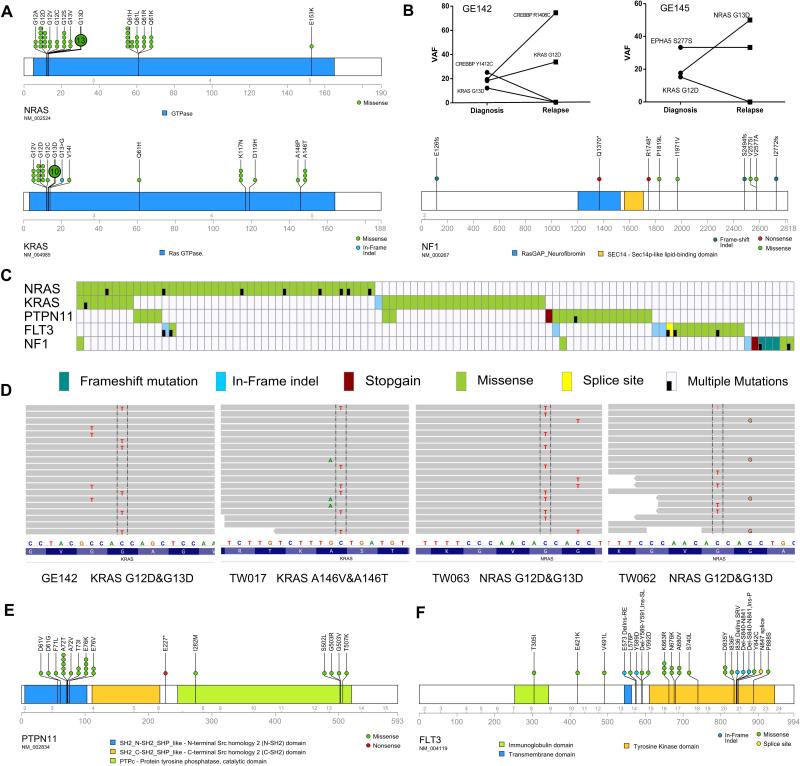
Figure 2. Recurrent mutations in RAS-RTK pathway.
A, schematic of the mutations in NRAS, KRAS and NF1. B, comparison of mutational allele frequency (VAF) of two cases harboring different RAS mutations at diagnosis and relapse. C, mutational heatmap of the RAS-RTK pathway genes. D, mutation phasing analysis depicting the mutually-exclusive pattern of RAS mutations in the leukemic cells of the same patient, four representative cases are shown. Sequencing reads are displayed at each locus as a gray bar. Mutations found in the reads (nucleotide differs from the reference sequence) are indicated and highlighted. E, F, schematic diagrams showing mutations of PTPN11 and FLT3, respectively.

