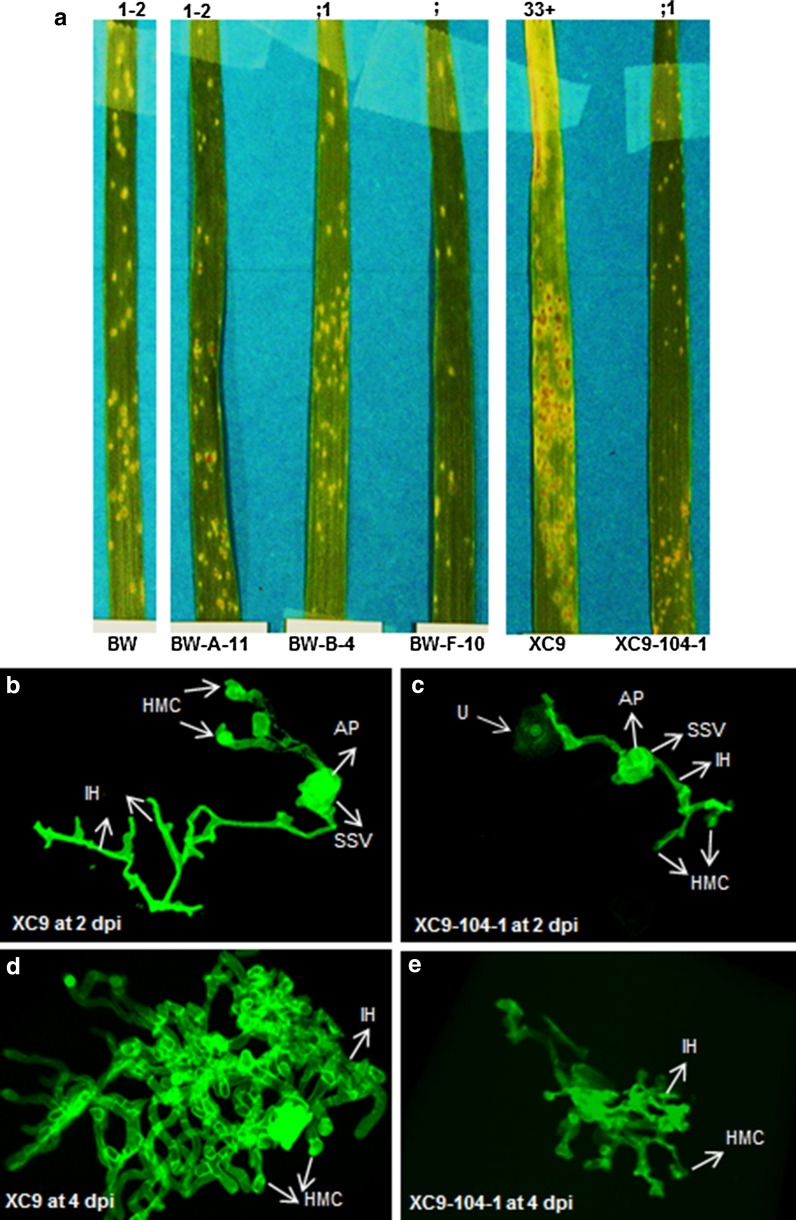
Fig. 2.
Photographs and confocal images of the representative leaves of non-transgenic and transgenic wheat lines infected with Pt race MCPSS. a Plants were scored for visual symptoms at 15 dpi and disease ratings were done on 0–4 scale as described in McIntosh et al. (1995). Average IT rating is listed on the top of each leaf. b Confocal microscopic image of XC9 at 2 dpi. c XC9-104-1 at 2 dpi. d XC9 at 4 dpi. e XC9-104-1 at 4 dpi. Between 10–15 leaf segments with infection foci were scanned. U urediniospore; GT germ tube; AP appresorium; HMC haustoria mother cell; SSV substomatal vesicle; IH infection hypha. Scale bar = 50 μm

