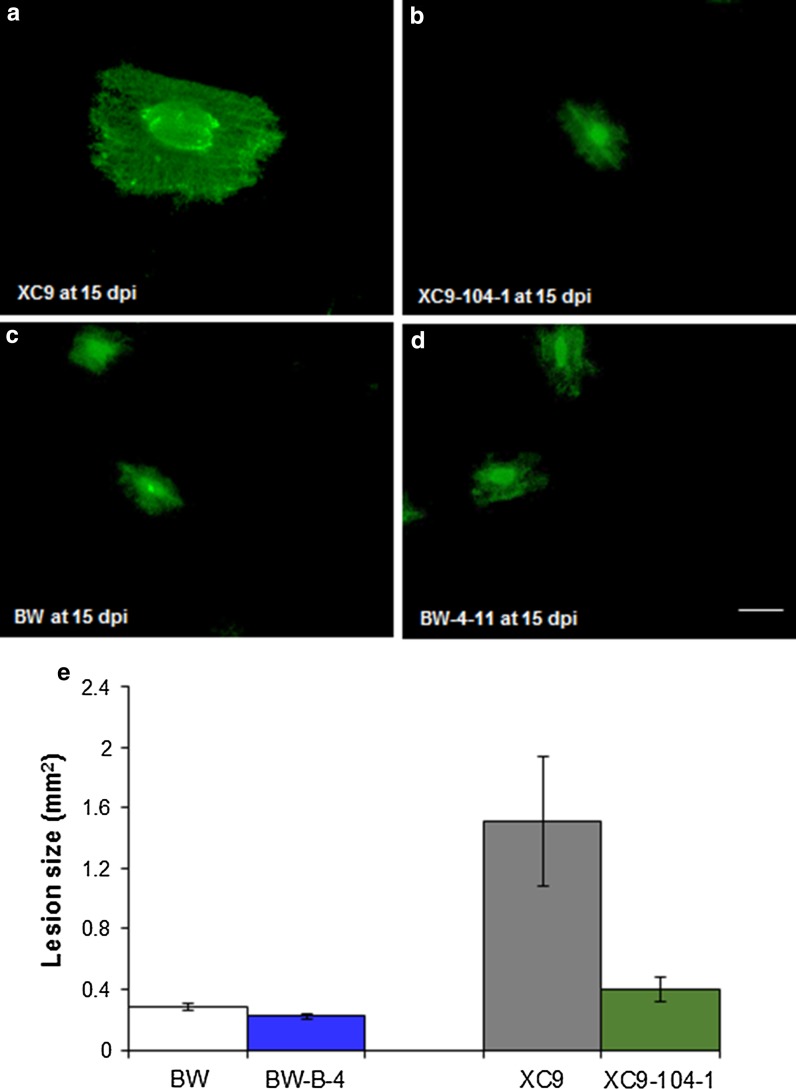
Fig. 3.
Representative fluorescence microscopic images of non-transgenic and transgenic wheat lines infected with Pt race MCPSS at 15 dpi. a XC9. b XC9-104-1. c BW. d BW-B-4. e Lesion size calculated using Image J. For lesion size measurements 12, 25, 19, 21 infection colonies for XC9, XC9-104-1, BW and B-4-11, respectively, were assessed. Error bars represent standard error of the means. Data were analyzed using Student’s t test, **** represents significance level at P < 0.0001. Scale bar 0.5 mm

