Fig. 1.

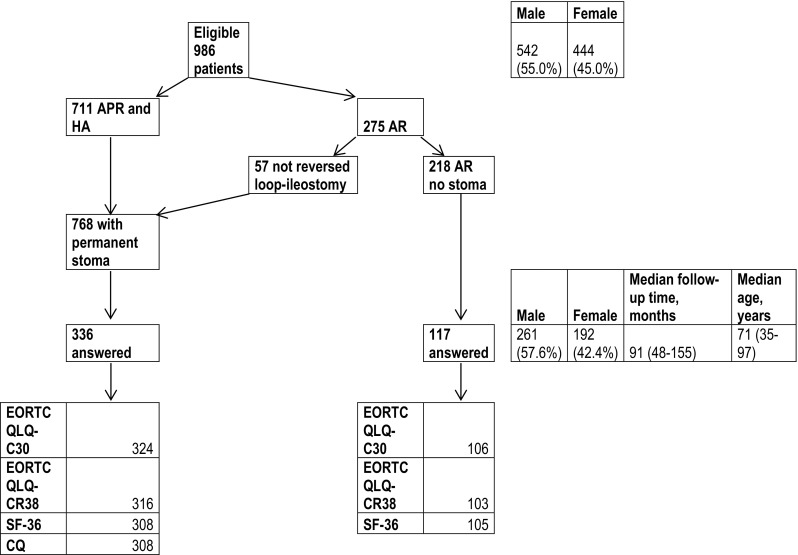
Diagram showing patients receiving HRQoL forms and distribution of answers. Gender, age and follow-up time in eligible patients and patients replying to the forms are shown on the right

Diagram showing patients receiving HRQoL forms and distribution of answers. Gender, age and follow-up time in eligible patients and patients replying to the forms are shown on the right