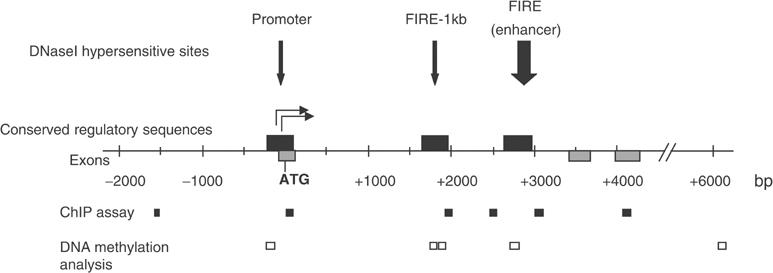
Figure 1.

Map of the c-fms regulatory region. DHSs present in macrophages are shown as vertical arrows. Numbers indicate the nucleotide position relative to the ATG start codon. Grey boxes represent exons, and black boxes show regions conserved between human and mouse. The main transcription start sites are indicated as horizontal arrows. Amplicons for ChIP assays and DNA methylation analysis are indicated.
