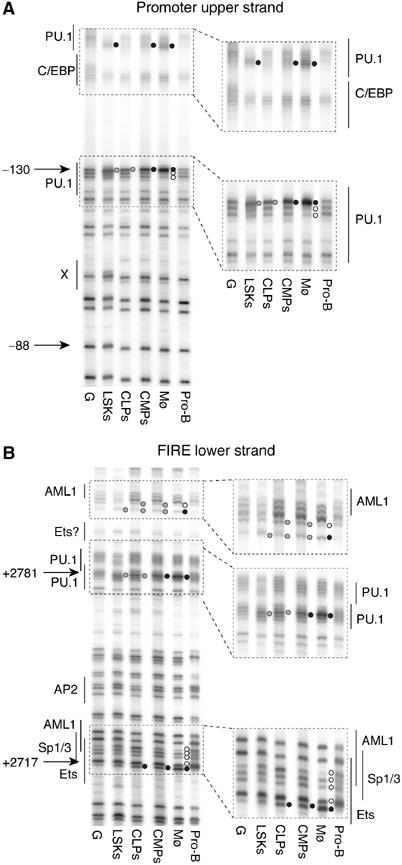
Figure 3.

Transcription factor binding to the c-fms promoter and FIRE is lost in pro-B cells. DMS footprinting analysis of promoter (upper strand) (A) and FIRE (lower strand) (B). The numbers on the left indicate the nucleotide position relative to the ATG codon. Transcription factor-binding sites and their nature as determined by ChIP assays and in vitro DNA–protein interaction studies (Tagoh et al, 2002; Follows et al, 2003) are indicated. Black circles indicate hypermethylated guanines, and open circles indicate hypomethylated guanines compared with DMS-treated naked DNA (G). Grey circles indicate weaker footprints. From left to right: DMS-treated naked DNA (G), purified cells (LSKs, CLPs, CMPs, bone marrow macrophages (Mø), freshly purified pro-B cells from RAG2−/− mice).
