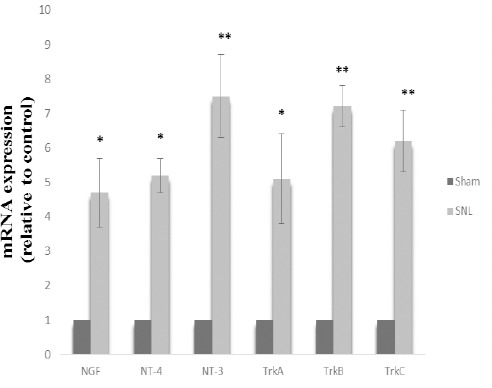
Figure 4.

Neurotrophin mRNA expression in sham and SNL groups. Data are shown as mean±SD. Data analysis was done by one sample t-test
Sham: non-operated animals group. SNL: spinal nerve ligation group
(*): Significant difference with the sham group (P≤0.05)
(**): Significant difference with the sham group (P≤0.001)
