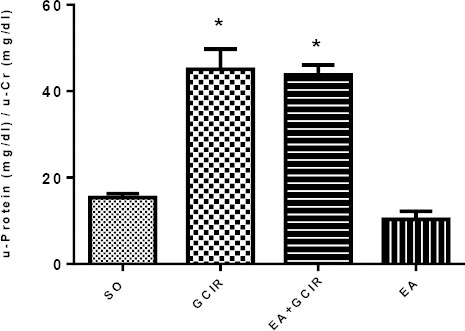
Figure 6.

Comparison of U-protein/U-Cr after GCIR in different rat groups [SO (Sham), GCIR (global cerebral ischemia reperfusion), EA+GCIR (ellagic acid 100 mg/kg, 10 days +global cerebral ischemia reperfusion), EA (ellagic acid 100 mg/kg, 10 days)]. * P<0.05 Significant compared to so group. Results are expressed as mean±SEM with eight rats per group; one way ANOVA followed by post-hoc LSD test was used
