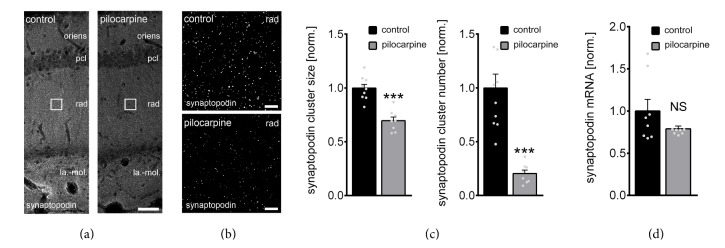
Figure 2.
Pilocarpine-induced status epilepticus (SE) affects synaptopodin clusters in CA1 stratum radiatum. (a–c) Synaptopodin cluster sizes and numbers were assessed in CA1 stratum radiatum of anatomically matched coronal sections containing the dorsal hippocampus from pilocarpine- or vehicle-only-treated animals. N control = 10 hippocampal slices of 5 animals, N pilocarpine = 8 hippocampal slices of 4 animals; both hippocampi in each animal analyzed; averaged values from 3 images obtained from each slice (stratum oriens, oriens; stratum pyramidale, pcl; stratum radiatum, rad; stratum lacunosum-moleculare, la.-mol.). Values normalized to control. Gray dots indicate individual data points (one data point outside the axis limits for control synaptopodin cluster number). Mann-Whitney test; ∗∗∗ P < 0.001. Scale bars, in (a) 50 μm, in (b) 4 μm. (d) Synaptopodin mRNA levels are not significantly changed after single episode of SE. The results are normalized to HPRT gene expression within the same cDNA sample and are represented as the relative levels of the mean ± SEM versus control. N = 8 hippocampi from 8 animals of each group. Mann-Whitney test; P = 0.63, NS, not significant difference.

