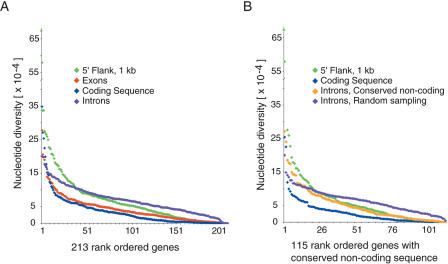
Figure 1.
Rank order of nucleotide diversity (π) in conserved noncoding, exon, intron, CDS, and 5′ flanking regions of the EGP genes. (A) Values are calculated for all 213 EGP genes for regions containing 1 kb 5′ of the transcription initiation site (green, 174 kb), exons (red, 483 kb), coding sequence (blue, 312 kb), and introns (purple, 3.26 Mb). (B) π values are calculated for 115 EGP genes that had significant amounts of intronic conserved noncoding sequence (as described in Methods) for regions containing 1 kb 5′ of the transcription initiation site (green, 91 kb), coding sequence (blue, 189 kb) and intronic conserved noncoding (orange, 170 kb), and randomly sampled intron (purple, 2.39 Mb). All categories were sorted independently before plotting. The randomly sampled intron category corresponds to the mean π value per gene obtained by 10,000 independent samplings of the same size range as the intronic conserved noncoding region for that gene. The average SEM for this sampling was 9.3E-06 with a minimum and maximum SEM of 3.12E-07 and 3.07E-05, respectively.

