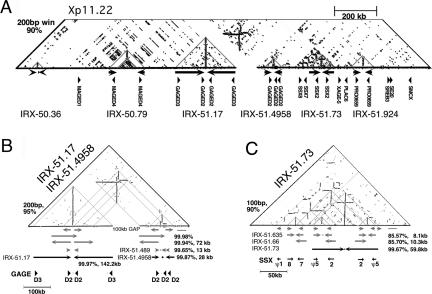
Figure 2.
IRs in Xp11.2. (A) Similarity dot-plot of 2 Mb from Xp11.2. Homologous regions indicated by horizontal lines (direct repeats) or vertical lines (inverted repeats). Six large IRs were detected in this region as vertical lines (gray triangles). No other significant sequence similarities were seen in the top portion of the dot-plot not shown. The window size and percent identity for the dot-plot are indicated. (B) Higher-resolution view of the region containing IRX-51.17 and IRX-51.4958, which both contain the GAGE-D genes. Arrows on the same line represent homologous regions as indicated by the dot-plot; percent identity indicated when calculated. Internal IRs detected by IRF are indicated, for example, IRX-51.489 (Supplemental data S1), and the midpoint of the spacer indicated by a dot. IRX-51.17 was not included in the final set of 96 large IRs. (C) Higher-resolution view of IRX-51.73 and surrounding region, which contains an SSX gene cluster. Both arms of the IRX-51.73 contain inverted copies of SSX2 and SSX pseudo5. As in B, internal IRs detected by IRF are indicated, for example, IRX-51.635, and the midpoint of the spacer of the IR for which details are provided is indicated by a dot (Supplemental data S1).

