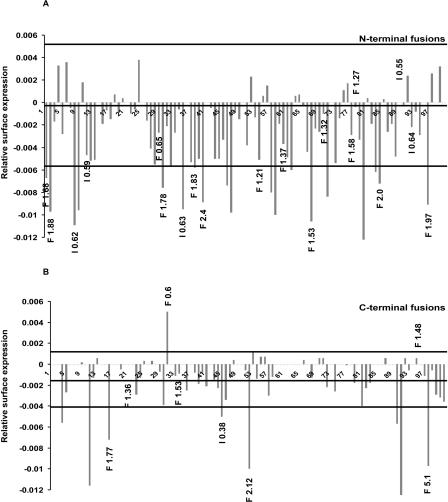
Figure 3.
Summary of the results of the transport and Golgi integrity assays. Graphical representation of slope values of all for N-terminal CFP (A) and C-terminal YFP fusions (B) tested in the transport assay. The three horizontal lines in each graph depict the following: The middle line represents the average slope value of the negative controls transfected with CFP or YFP alone (-0.0002 and -0.0015 in A and B, respectively); the upper and lower lines indicate the interval, which is defined by the respective standard deviations of the population for the controls (from -0.0057 to 0.0053 and from -0.0041 to 0.0011 for A and B, respectively). Only those clones with slope values outside the respective intervals were assigned as effectors in the transport assay. The clones which induced alterations of the Golgi complex are depicted by the black numbers at the tips of the respective bars. “F” and “I” indicate changes in fragment number and intensity, respectively. The clones are numbered from 1 to 100 in ascending order of their accession numbers.

