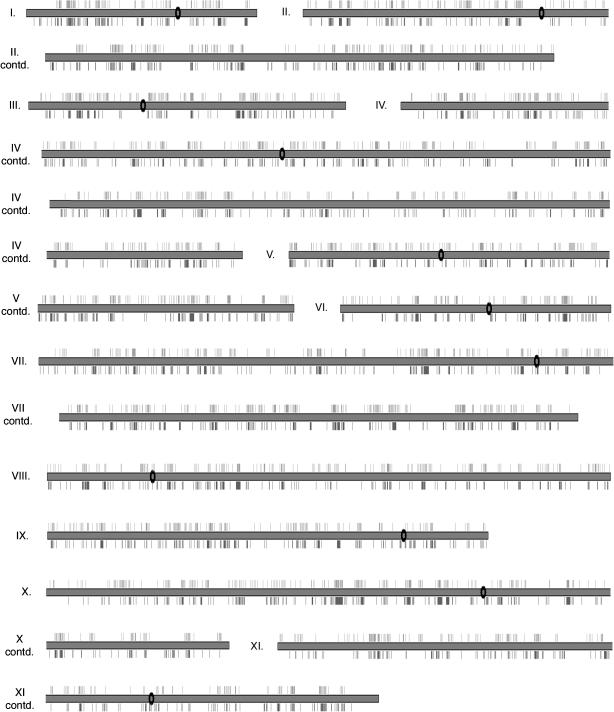
Figure 3.
Distribution of Tn7 and Tn3 insertions in the S. cerevisiae genome. Chromosomal map of sequenced transposon insertions wherein each chromosome is represented by a gray rectangle; chromosomes are split over multiple lines as necessary. The black oval indicates centromeric sequence (not drawn to scale). Tn7 insertions are shown facing upwards. Previously identified Tn3 insertions are shown facing downwards.

