Figure 2.

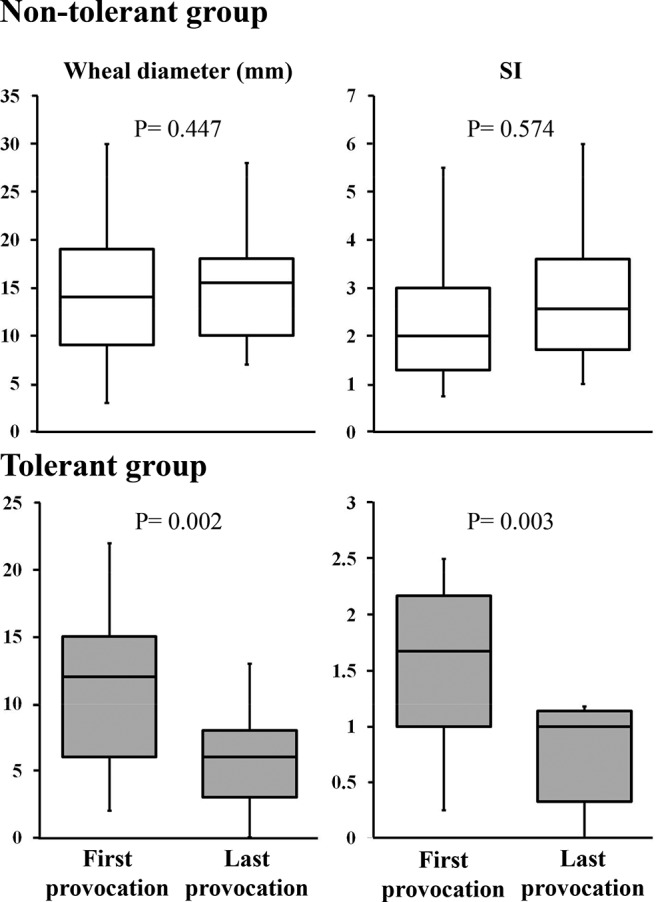
Skin-prick test results for the nontolerant (n = 30) (white box) and tolerant (n = 15) (gray box) groups. Skin-prick test results were assessed by using the Wilcoxon rank sum test.

Skin-prick test results for the nontolerant (n = 30) (white box) and tolerant (n = 15) (gray box) groups. Skin-prick test results were assessed by using the Wilcoxon rank sum test.