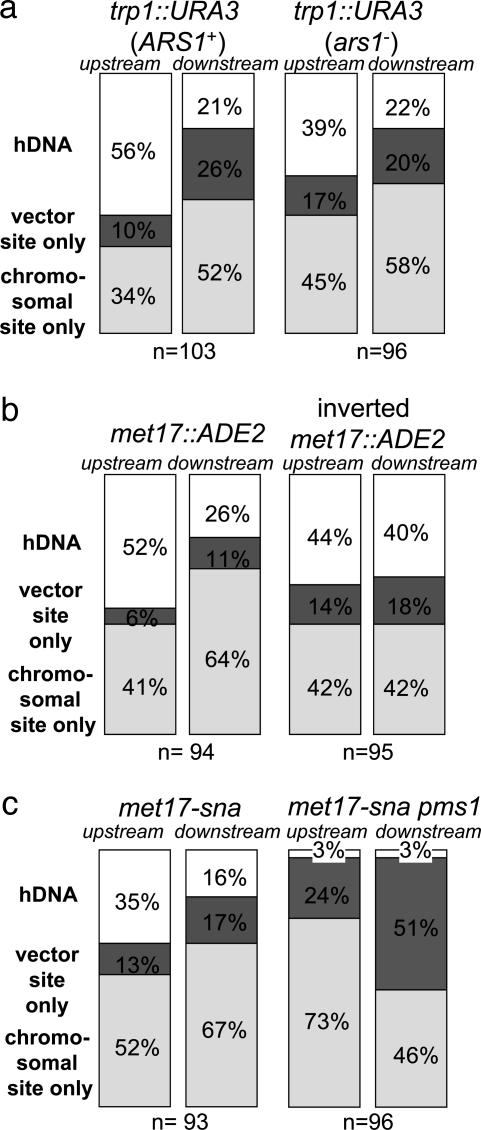
Fig. 3.
hDNA formation during gene targeting. hDNA was analyzed by restriction analysis after gene targeting of each indicated strain. The number of transformants analyzed in each strain is indicated. Each stacked bar indicates the percentage of transformant colonies containing only the chromosome-specific (Bottom, chromosomal site only), only the targeting vector-specific (Middle, vector site only), or a mixture of both (Top, hDNA) restriction sites in the upstream or downstream flanking regions. (a) Gene replacement at the TRP1 locus. (b) Gene replacement at the MET17 locus. (c) Mutation correction by gene targeting at the MET17 locus.

