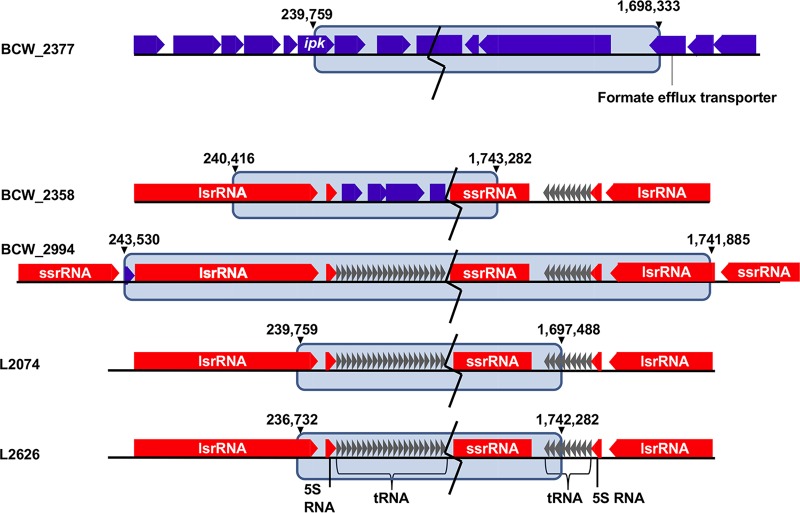
FIG 3.
MAUVE alignments of L. monocytogenes large-scale inversion junctions. The gene contents of large-scale inversion junctions are illustrated. Due to the large inversion sizes, breaks in the inversion are displayed as black zigzag lines to highlight junction regions. rRNA genes are represented as red arrows, tRNA genes are represented as gray arrows, and all other genes are represented as blue arrows. The inversion region is highlighted by the blue blocks, with inversion genome coordinates listed at the ends of each block. Additional metadata for all strains are provided in Tables S1 and S2 in the supplemental material.

