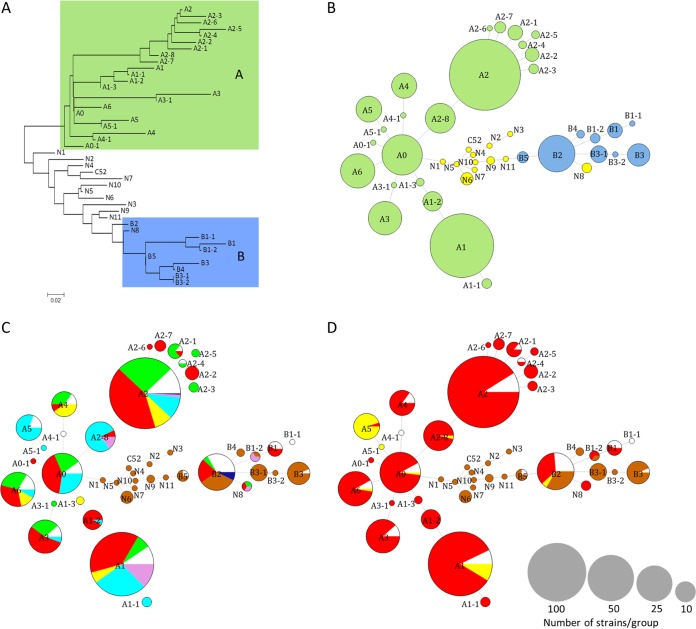
FIG 3.
Distribution of strains in phylogroups. (A) A neighbor-joining tree was constructed using the 43 different concatenated sequences of SNP identified by analyzing 577 O. oeni strains. (B to D) Minimum spanning trees represent the distribution of strains in the genetic groups and subgroups and are colorized according to their groups of affiliation (B), their region of origin (C), and their wine or cider of origin (D). The size of the circles is proportional to the number of strains belonging to the phylogroup: maximum 148 for A2 and minimum 1 for the smallest.

