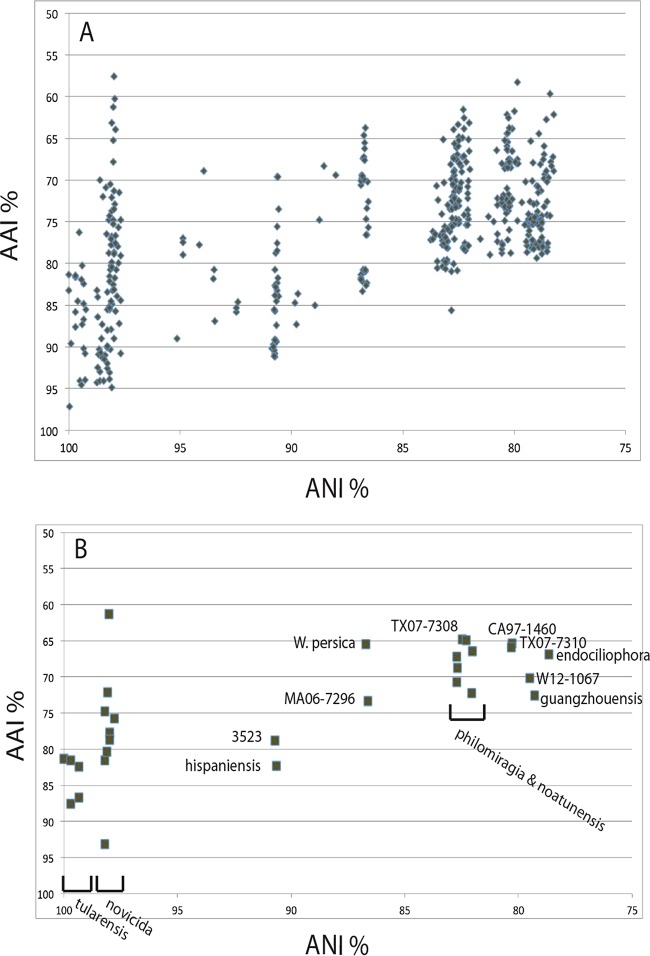
FIG 2.
Relationships among calculated ANI and AAI percent between each pair of Francisella isolates listed in Table 1 (n = 31). (A) Relationships among all of the isolates; (B) calculated values for each isolate compared to the F. tularensis subsp. tularensis Schu4 genome.

